WHERE BABIES ARE BORN
Prism · Demographics
U.S. Census Bureau ACS · SmartAsset · 2025
WHERE
BABIES ARE
BORN
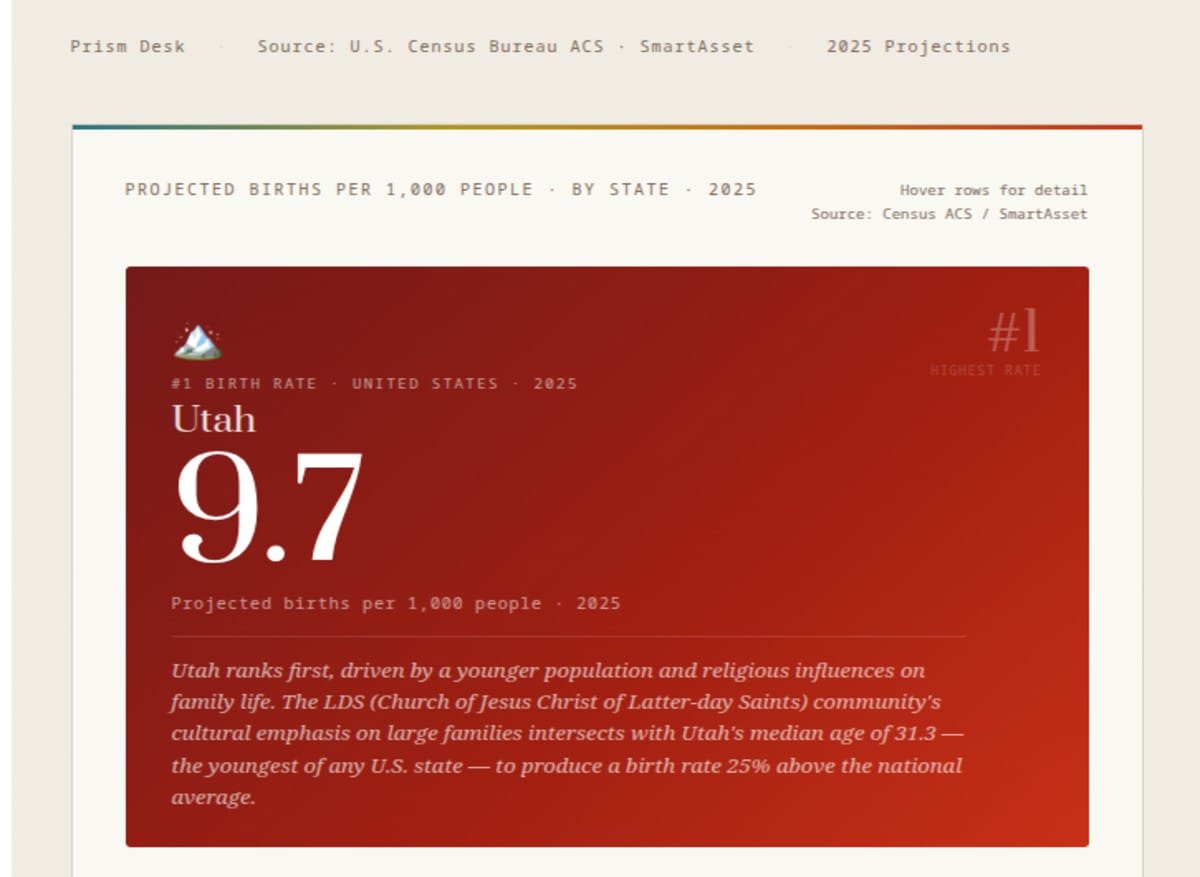
Utah projects 9.7 births per 1,000 people in 2025 — the highest rate in the United States, driven by the youngest median age of any state and the pronounced family-formation culture of its LDS population. North Dakota (9.0) and Colorado (9.2) follow. Vermont (7.5) and Wyoming (7.6) anchor the low end. California leads in absolute numbers with 344,000 projected births despite sitting near the national average in rate.
Metric: Projected births per 1,000 people · 2025 · and absolute projected birth count by state
#1 by rate: Utah 9.7 (youngest population + LDS family culture)
#1 by absolute births: California 344K (largest population)
Source: U.S. Census Bureau 1-Year American Community Survey 2024 via SmartAsset
#1 by rate: Utah 9.7 (youngest population + LDS family culture)
#1 by absolute births: California 344K (largest population)
Source: U.S. Census Bureau 1-Year American Community Survey 2024 via SmartAsset
Prism Desk·Source: U.S. Census Bureau ACS · SmartAsset·2025 Projections
Projected Births per 1,000 People · by State · 2025
Hover rows for detail
Source: Census ACS / SmartAsset
Source: Census ACS / SmartAsset
#1Highest rate
🏔️
#1 Birth Rate · United States · 2025
Utah
9.7
Projected births per 1,000 people · 2025
Utah ranks first, driven by a younger population and religious influences on family life. The LDS (Church of Jesus Christ of Latter-day Saints) community's cultural emphasis on large families intersects with Utah's median age of 31.3 — the youngest of any U.S. state — to produce a birth rate 25% above the national average.
7.4
9.7
↑ Darker = higher birth rate
Top 10 states by absolute projected births · 2025
Utah's Exception9.7Youngest median age (31.3)
LDS family culture
25% above national average
LDS family culture
25% above national average
South & Plains Belt8.4–9.0TX 8.9 · ND 9.0 · OK 8.4
Higher fertility, younger demo
Religious and rural patterns
Higher fertility, younger demo
Religious and rural patterns
Low-Rate Northeast7.4–7.7VT 7.5 · ME 7.4 · FL 7.7
Older populations · higher cost
Delayed family formation
Older populations · higher cost
Delayed family formation
California paradox: California has the highest absolute birth count (344K) but a birth rate of only 8.7 — near the national average. The size of the state's population overwhelms a below-peak birth rate to produce the most births of any state. Texas at 278K (8.9/1K) is second. Together they project 622K births — approximately 16% of the national total — from two states that contain roughly 24% of the U.S. population.
Source: U.S. Census Bureau 1-Year American Community Survey 2024 via SmartAsset · 2025 projections
9.7Utah
Highest Rate
Highest Rate
7.4Maine
Lowest Rate
Lowest Rate
344KCalifornia
Most Births
Most Births
54.7%Top 10 States'
Share of Births
Share of Births
Rate vs. Count: The Two Maps of American Fertility
The U.S. Census Bureau's American Community Survey data on projected 2025 births produces two distinct maps depending on how you look at it. The birth rate map — births per 1,000 people — shows Utah dominant at 9.7, flanked by North Dakota and Colorado, with the rural mountain and plains states and parts of the South elevated above the coastal and northeastern states that sit near or below the national average. The absolute count map shows California (344K), Texas (278K), Florida (181K), and New York (173K) dominating simply because they contain the most people. Both maps are telling the truth; they are telling different truths about different dimensions of American demographic reality.
The distinction matters because birth rate and absolute birth count have different downstream consequences. Birth rate drives state-level age structure: a high birth rate state like Utah continuously refreshes its working-age population, creating a young demographic pyramid that supports pension systems, labour markets, and educational infrastructure in ways that low-birth-rate states cannot. Absolute birth count drives federal political representation (Congressional apportionment is population-based) and drives the scale of educational, healthcare, and social service demand in ways that rate alone does not capture. California's 344,000 births at a modest rate and Utah's high rate but smaller absolute count are equally significant — to different audiences with different policy concerns.
Utah at 9.7 births per 1,000 — 25% above the national average, driven by the youngest median age in the country and the most pronounced family-formation culture. California at 8.7 produces 344,000 births. Rate and count are measuring different things. Both matter.
Utah at 9.7: The Demography of Faith
Utah's birth rate of 9.7 — the highest of any U.S. state and 25% above the national average — reflects the intersection of two reinforcing demographic factors. The first is structural: Utah has the youngest median age of any state at 31.3 years, compared to a national median of approximately 38.5 years. A population that skews younger simply has more people of prime childbearing age in its age pyramid, producing a higher crude birth rate independent of any cultural factor. A state where a large fraction of the population is between 20 and 35 will have a higher birth rate than a demographically older state even if their age-specific fertility rates are identical.
The second factor is the cultural and religious influence of the Church of Jesus Christ of Latter-day Saints (LDS), whose members constitute approximately 62% of Utah's population. LDS theology and culture place significant emphasis on large families as a spiritual calling and a form of religious practice, and Utah's total fertility rate — the average number of children a woman will have over her lifetime — has historically been the highest of any U.S. state by a substantial margin. The combination of a young population base and a high age-specific fertility rate creates a multiplicative effect that produces Utah's extraordinary birth rate position.
The Utah pattern is a useful natural experiment in the relationship between religion and fertility. Research across many contexts has found that religious practice — particularly in traditions with explicit pronatalist theology — is one of the most robust predictors of higher fertility. The LDS effect in Utah is the most visible American example of this general finding. As LDS membership rates among Utah residents have modestly declined over the past two decades, Utah's birth rate advantage has slightly narrowed but remains dominant — suggesting the effect is deeply embedded in both the religious community and the broader cultural norms it has shaped in the state.
The Northeast's Low Rates: Cost, Education, and Delayed Formation
Vermont at 7.5 and Maine at 7.4 — the lowest rates in the continental United States — reflect a cluster of factors that are also visible across the broader pattern of low-birth-rate states: high median age, high cost of living relative to median income, high educational attainment (which correlates globally with delayed and reduced childbearing), and lack of the religious and cultural factors that elevate birth rates in the South, Mountain West, and Plains states. Vermont's population is among the oldest in the country (median age approximately 43), it has among the highest housing costs as a percentage of median income, and it has the highest rate of educational attainment in the country by some measures.
The relationship between housing costs and fertility is one of the most robust findings in the demographic economics literature. When housing costs are high relative to income — and particularly when the cost of adequate housing for a family is substantially higher than for a single person or a couple — young people delay family formation. The data from high-cost coastal states (California 8.7, New York 8.7, Massachusetts 8.9) show birth rates near or at the national average rather than dramatically below it, which suggests that the cost effect is real but not determinative at the state level — it is moderated by the large immigrant populations in these states, who have significantly higher fertility rates than the native-born population.
California at 344,000: Immigration and the Fertility Floor
California's 344,000 projected births in 2025 — the highest absolute count of any state by a wide margin — despite a birth rate of only 8.7 (near the national average) illustrates the crucial role of immigration in American fertility statistics. California has the largest immigrant population of any state in absolute terms, and immigrant women consistently have higher fertility rates than U.S.-born women in most ethnic and national-origin groups. The aggregate 8.7 birth rate for California reflects a weighted average of a relatively low-fertility U.S.-born white and Asian population with a higher-fertility first-generation immigrant population, primarily from Latin America and parts of Southeast Asia.
This immigration-fertility relationship is not unique to California. Texas at 278K and Florida at 181K also benefit from significant immigrant populations, and the South's relatively elevated birth rates reflect in part the growing Latin American immigrant populations of states like Georgia, North Carolina, and Tennessee as well as the higher fertility rates of the region's native-born Black and Hispanic populations. American birth rates, to a significant degree, are sustained by immigration-driven demographic renewal in a context where the native-born population's fertility is at or below replacement level. The total fertility rate for U.S.-born women has been below 2.1 (the replacement level) for multiple years, and the overall U.S. TFR — approximately 1.62 in the most recent data — is held up in part by the higher fertility of immigrant women, though that advantage narrows in the second generation.
American birth rates are substantially sustained by immigration-driven demographic renewal. The native-born TFR is below replacement; the overall figure is held up by the higher fertility of first-generation immigrants. This is not a policy argument — it is simply a demographic description of how the U.S. is reproducing itself.
The 54.7% Concentration: Ten States, Half the Babies
The top 10 states by absolute birth count — California, Texas, Florida, New York, Illinois, Pennsylvania, Ohio, Georgia, North Carolina, and Michigan — account for 54.7% of all U.S. births in 2025. This concentration is slightly higher than those states' share of U.S. population (approximately 50%), reflecting the relatively younger and more diverse demographics of the large Sun Belt and Great Lakes states compared to smaller, older states in the Northeast and Mountain West.
The 54.7% figure has direct implications for the geographic distribution of future labour supply, educational demand, and consumer market growth. States with large absolute birth counts are building the future workforce and consumer base that will define their economies in 20-30 years. California and Texas in particular — with a combined 622,000 projected births representing approximately 16% of the national total — are generating the demographic base for continued economic scale even as internal migration patterns move some of their existing adult population to lower-cost states. The birth count figures suggest that California and Texas will remain demographic powerhouses for decades regardless of current migration trends, because they are producing the next generation of residents at a rate that out-builds the departures.
What a 7.6 National Rate Means
Synthesising the state-level data, the national crude birth rate — approximately 8.3 per 1,000 people — translates to a total fertility rate well below the 2.1 replacement level. The United States is, like virtually every other developed nation, in a fertility shortfall that will compound over the coming decades as the large Baby Boom cohort continues to leave the working-age population and relatively smaller younger cohorts replace them. The state-level variation documented in this data is meaningful but does not change the national trajectory: even Utah at 9.7 per 1,000 crude birth rate likely corresponds to a TFR somewhat below the historical LDS norm, as the community's fertility has gradually converged toward national patterns.
The policy implications of sustained below-replacement fertility are extensive and contested: immigration to supplement the workforce, pension reform to adjust for changing worker-to-retiree ratios (as documented in the companion Prism piece on public pension demographics), productivity investment to offset slower labour force growth, and family support policies (childcare subsidies, parental leave, housing support) aimed at making the economic conditions for family formation less prohibitive. The state-level birth rate data is a ground-level view of a national challenge — a mosaic of local demographic realities that together describe the reproductive choices Americans are making under the economic and cultural conditions they actually inhabit, rather than the ones a policy designer might prefer.
End of Brief · Prism