Top Countries by Electricity Generation
Prism · Energy & Power Infrastructure
Top Countries by
Electricity
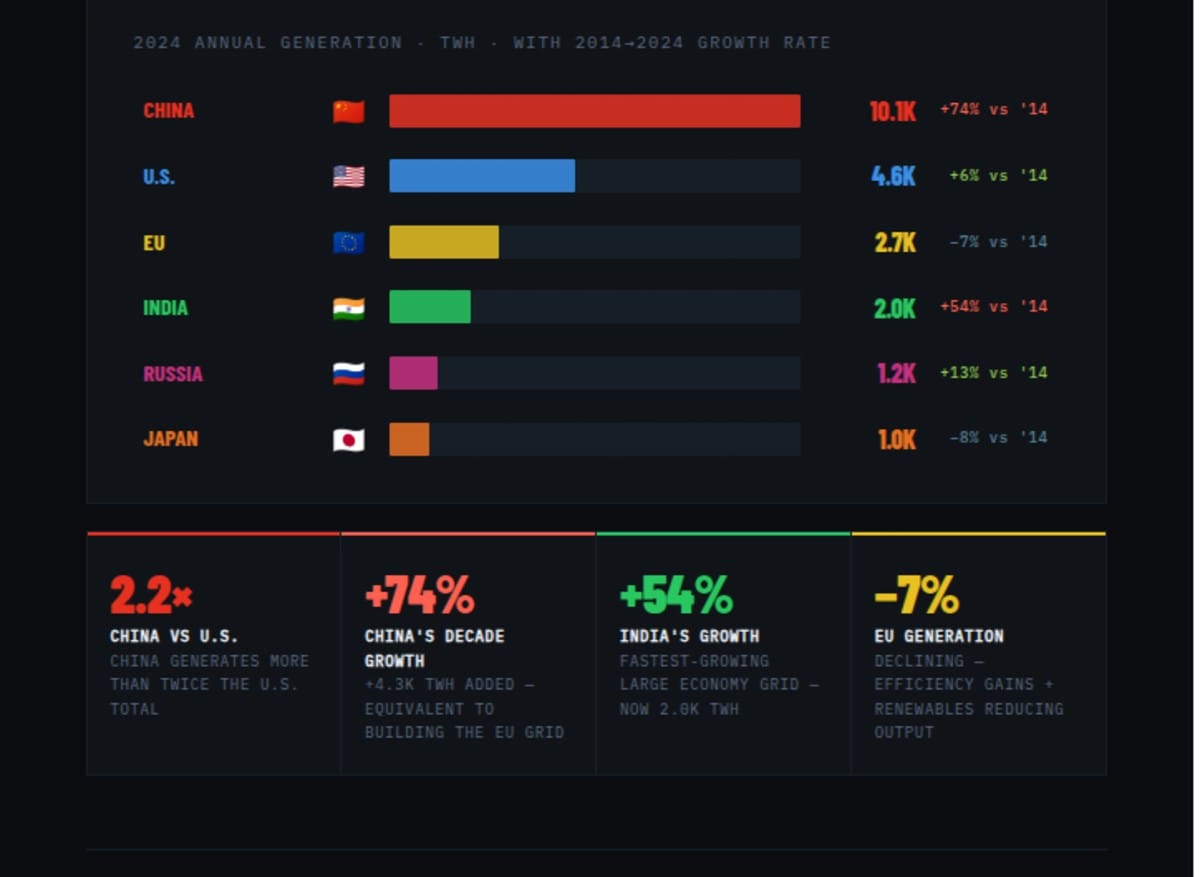
Generation China now generates 10.1 terawatt-hours of electricity annually — more than double the United States. Over a decade in which U.S. generation grew 6%, China's grew 74%. The gap is no longer closing — it is widening.
Electricity
Generation China now generates 10.1 terawatt-hours of electricity annually — more than double the United States. Over a decade in which U.S. generation grew 6%, China's grew 74%. The gap is no longer closing — it is widening.
10.1K
China TWh 2024
4.6K
U.S. TWh 2024
+74%
China growth 2014→2024
+6%
U.S. growth 2014→2024
⚡ AI Bottleneck
"Maybe later this year, we will be producing more chips than we can turn on, except for China. China's growth in electricity is tremendous." — Elon Musk. AI data centre construction has made electricity availability the primary constraint on US AI infrastructure expansion.
Electricity Generation 2014–2024 · Terawatt-hours · Click legend to toggle countries
Source: Energy Institute Statistical Review of World Energy 2025 · TWh = Terawatt-hours · Annual electricity generation
2.2×
China vs U.S.
China generates more than twice the U.S. total
China generates more than twice the U.S. total
+74%
China's decade growth
+4.3K TWh added — equivalent to building the EU grid
+4.3K TWh added — equivalent to building the EU grid
+54%
India's growth
Fastest-growing large economy grid — now 2.0K TWh
Fastest-growing large economy grid — now 2.0K TWh
−7%
EU generation
Declining — efficiency gains + renewables reducing output
Declining — efficiency gains + renewables reducing output
China's Grid: The World's Most Consequential Infrastructure Story
China's 10.1 terawatt-hours of annual electricity generation in 2024 is a figure that requires repetition to fully absorb: it is more electricity than the United States, the European Union, India, Russia, and Japan combined — the five next-largest generators — produce in total. China's grid has grown by 4.3 terawatt-hours over the decade from 2014 to 2024, an increment that is itself equivalent to the entire European Union's electricity system. No economy in history has built electricity generation capacity at this scale, at this speed. The growth has been driven by the simultaneous expansion of coal power — which remains the backbone of Chinese baseload generation — and the world's largest build-out of solar and wind capacity, which China has installed at a pace that dwarfs any other country's clean energy programme.
The coal-and-renewables paradox at the heart of Chinese electricity policy reflects the country's specific development constraints. China has approximately 1.4 billion people, an industrial base that consumes more steel, cement, and manufactured goods than any other economy, and an economic model that has historically required sustained GDP growth rates of 5–8% annually to maintain social stability. These demands require electricity at volumes and reliability levels that renewables alone — given current storage technology — cannot provide. China's approach has been to build both simultaneously: coal plants for baseload reliability and solar/wind for the marginal growth in demand, while developing battery storage and smart grid infrastructure that may eventually allow the coal baseload to be gradually retired. Whether this sequencing represents a pragmatic path to decarbonisation or a structural coal lock-in remains the central debate in international climate policy.
China added 4.3 terawatt-hours of electricity generation in a decade. That is the equivalent of building the entire EU electricity grid from scratch — in ten years. The US added 0.26 terawatt-hours over the same period. These are not just energy statistics. They are industrial capacity statistics.
The American Electricity Stagnation
The United States' 6% growth in electricity generation over the 2014–2024 decade — from approximately 4.3 terawatt-hours to 4.6 terawatt-hours — reflects a structural feature of advanced economy electricity systems that is poorly understood in public discourse: energy efficiency. As buildings become better insulated, appliances more efficient, industrial processes more optimised, and services replace manufacturing as the dominant economic activity, the amount of electricity required to produce a given unit of GDP declines. The US economy grew substantially in real terms over this period; the fact that electricity generation grew only 6% reflects that the same economic output is being produced with less energy per unit of production. Flat or slow electricity growth in advanced economies is not a sign of economic failure — it is, in part, a sign of energy efficiency success.
But this framing is now under serious pressure. The AI data centre buildout of 2023–2026 has introduced an unprecedented source of new electricity demand: large language model training and inference require enormous amounts of power, and the scale of data centre construction that AI investment is driving has created a demand signal that US grid operators have not seen since the mid-20th century electrification era. The constraint on US AI infrastructure expansion has shifted from compute availability to electricity availability — power purchase agreements for new data centres are being signed years in advance, and the grid connection queues in data centre hotspot states (Virginia, Texas, Georgia) are measured in years rather than months. The US electricity generation figure will not remain at 6% decade growth if the AI infrastructure build continues at its current pace.
India's Energy Trajectory
India's 54% growth in electricity generation over the 2014–2024 period — from approximately 1.3 terawatt-hours to 2.0 terawatt-hours — places it as the fastest-growing major economy electricity system in the dataset. India's growth profile resembles China's 20 years earlier: a rapidly expanding manufacturing sector, urbanisation producing new residential electricity demand, and a government with explicit targets for both industrial expansion and renewable energy deployment. India has made substantial commitments to solar and wind capacity and has genuine renewable resources — the subcontinent's solar irradiance and wind corridors are exceptional. The constraint on India's clean electricity transition, as with China, is grid reliability and storage rather than generation resource availability: Indian grid operators face reliability challenges from intermittent renewables without sufficient storage or flexible backup capacity.
Europe's Declining Generation and What It Signals
The European Union's approximately 7% decline in electricity generation over the 2014–2024 period is the most misunderstood data point in this dataset. It does not reflect economic contraction — European GDP grew over this period. It reflects, primarily, three factors: exceptional energy efficiency gains in buildings and industry driven by the post-2022 energy price shock, the closure of nuclear plants (primarily in Germany) that reduced total generation capacity, and the increasing penetration of distributed solar generation that may not be fully captured in centrally-reported generation statistics. The post-2022 European energy response — forced by Russian gas supply disruption — produced the largest involuntary energy efficiency programme in history, compressing industrial and residential consumption at a pace that decades of voluntary efficiency policy had failed to achieve. The question is whether these consumption reductions are permanent or temporary as energy prices normalise.
End of Brief · Prism