THE WORLD'S MOST IMPORT- DEPENDENT
Prism · Trade & Small States
World Bank · 2024
THE WORLD'S
MOST IMPORT-
DEPENDENT
Nearly 90% of the top 30 most import-dependent economies have populations under 10 million. Small states, island nations, and trading hubs dominate this list not because of policy failure but because of geography and economic model. Hong Kong re-exports goods. Nauru has no arable land. Kiribati consists of 33 atolls. Malta is 316 square kilometres. Imports are not a vulnerability — for most of these countries, they are the entire economy.
Metric: Imports of goods and services as % of GDP · 2024 (or latest available)
Key finding: ~90% of top 30 have populations under 10M · Islands and micro-states dominate
Cuba annotation: Imports 70–80% of its food given limited agricultural resources
Source: World Bank · 2024
Key finding: ~90% of top 30 have populations under 10M · Islands and micro-states dominate
Cuba annotation: Imports 70–80% of its food given limited agricultural resources
Source: World Bank · 2024
Prism Desk·Source: World Bank·2024
Most Import-Dependent Countries · Imports as % of GDP · 2024
Hover rows · colour = region
Source: World Bank
Source: World Bank
#1Most import-
dependent
🇭🇰
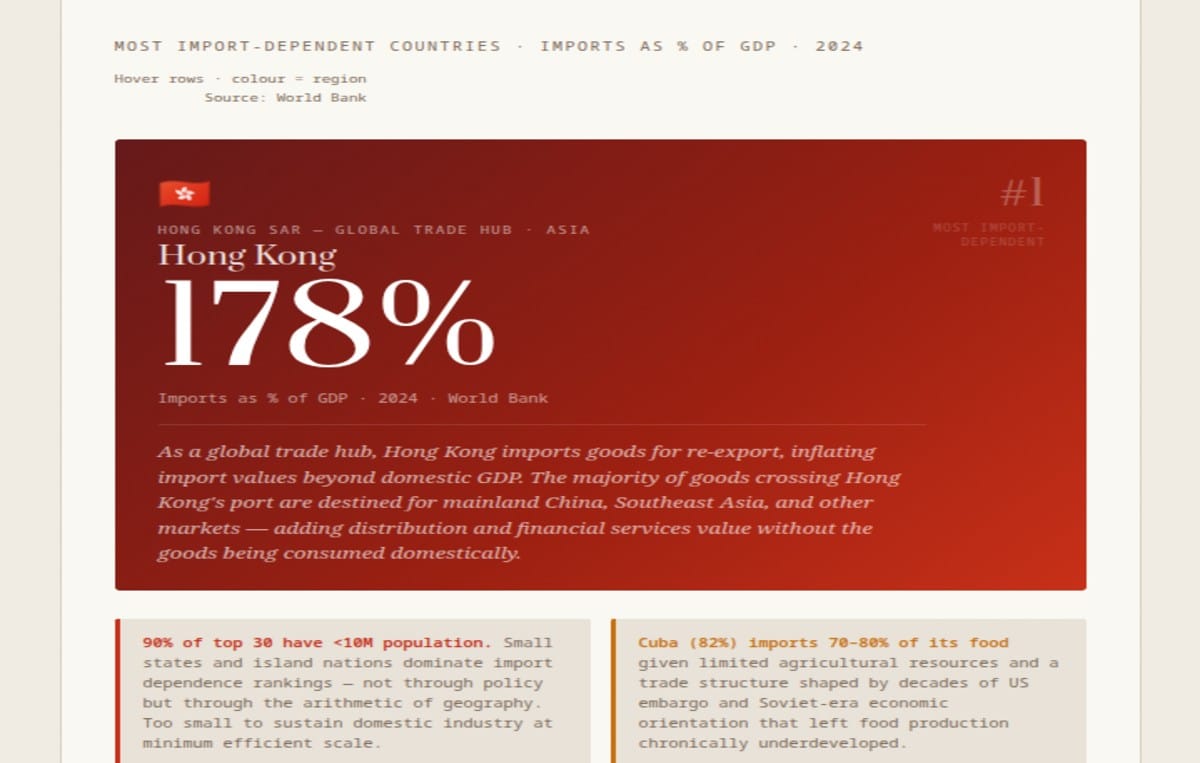
Hong Kong SAR — Global Trade Hub · Asia
Hong Kong
178%
Imports as % of GDP · 2024 · World Bank
As a global trade hub, Hong Kong imports goods for re-export, inflating import values beyond domestic GDP. The majority of goods crossing Hong Kong's port are destined for mainland China, Southeast Asia, and other markets — adding distribution and financial services value without the goods being consumed domestically.
dependent
90% of top 30 have <10M population. Small states and island nations dominate import dependence rankings — not through policy but through the arithmetic of geography. Too small to sustain domestic industry at minimum efficient scale.
Cuba (82%) imports 70–80% of its food given limited agricultural resources and a trade structure shaped by decades of US embargo and Soviet-era economic orientation that left food production chronically underdeveloped.
Asian HubsHK · SG · UAERe-export economies
178% · 144% · 92%
Trade > domestic consumption
178% · 144% · 92%
Trade > domestic consumption
Pacific Islands6 in top 30Nauru · Kiribati · Palau
Marshall Islands · Seychelles
No domestic production possible
Marshall Islands · Seychelles
No domestic production possible
Small European States8 in top 30Luxembourg · San Marino · Ireland
Malta · Slovak Rep. · Estonia
EU single market amplifies flows
Malta · Slovak Rep. · Estonia
EU single market amplifies flows
Import dependence ≠ vulnerability. For most countries on this list, high import reliance is not a policy problem to be solved — it is the structural expression of economic specialisation. Luxembourg specialises in finance; it doesn't need to grow its own food or smelt its own steel. Singapore specialises in logistics and semiconductors; it imports everything else. The question is whether imports are funded by equivalent exports and services — for trading hubs, they are. For food-import-dependent island nations with no export base, the calculus is different and more fragile.
Source: World Bank · Imports of goods and services as % of GDP · Data as of 2024 or latest available
178%Hong Kong
Highest
Highest
~90%Top 30 with
Pop <10M
Pop <10M
8European States
in Top 30
in Top 30
70–80%Cuba Food
Import Share
Import Share
The Small State Paradox
The World Bank's import dependence data — imports of goods and services as a share of GDP — produces a top-30 list that is striking in its demographic homogeneity: approximately 90% of the countries on it have populations under 10 million. This is not coincidence. It reflects one of the most robust relationships in international economics: the inverse correlation between country size and trade openness. Small countries trade more (as a share of their economies) than large countries, for reasons that are deeply structural and largely immutable by policy.
The logic is straightforward: producing a good domestically requires a market large enough to support the minimum efficient scale of production. An automobile plant requires hundreds of thousands of units of annual demand to be cost-competitive; a semiconductor fab requires billions. A country of 50,000 people (Nauru: population approximately 10,000) or 500,000 people (Luxembourg: approximately 660,000) simply cannot provide the domestic demand to support the full range of industries that a continent-sized economy can. The smaller the domestic market, the more activities are better served by international specialisation and trade — producing a narrow range of goods or services efficiently for export, and importing everything else.
Nauru has 10,000 people and imports 111% of GDP. It has no choice. Kiribati consists of 33 atolls scattered across 3.5 million square kilometres of ocean. Its 111,000 people cannot mine steel, manufacture electronics, or produce most of what they consume. Import dependence here is the arithmetic of geography.
Hong Kong at 178%: Re-Export Economics
Hong Kong's extraordinary 178% figure — the highest in the world — reflects the specific mechanics of the re-export model already explored in the companion Prism piece on import reliance by country. The key additional insight from this more focused ranking is the sheer scale of Hong Kong's outlier status even within a list of already highly import-dependent economies: Luxembourg at 160% is the next highest, and Hong Kong exceeds it by 18 percentage points. Singapore at 144% is another 34 points below Hong Kong. The gap between Hong Kong and its nearest peer-group members is as large as the gap between Singapore and Belgium.
The reason for Hong Kong's extreme position is the specific structure of its re-export trade: Hong Kong is not just a trading hub, it is the trading hub for mainland Chinese exports and for goods destined for the Chinese market — the world's second largest import market by total value. The sheer volume of goods that China exports and imports, channelled through Hong Kong's port and financial infrastructure, creates import statistics that are multiples of Hong Kong's domestic GDP in a way that even Singapore's significant entrepôt role does not replicate at equivalent magnitude.
Pacific Islands: The Geography of Dependency
Nauru (111%), Seychelles (103%), Kiribati (102%), Marshall Islands (82%), Palau (80%), and Maldives (78%) represent the Pacific and Indian Ocean island economies whose import dependence is not an economic model choice but a geographic constraint. These countries share several characteristics: small and dispersed land area with limited agricultural potential, small populations insufficient to support most industries at minimum efficient scale, and isolation from continental supply chains that makes domestic production of most goods prohibitively expensive.
Nauru's case is among the most extreme globally. A 21-square-kilometre island in the Pacific with a population of approximately 10,000, Nauru was once one of the wealthiest countries in the world per capita due to its phosphate deposits, which were mined and exported over several decades. The phosphate revenue funded imports of essentially everything — food, construction materials, machinery, fuel, consumer goods. When the phosphate reserves were largely exhausted in the 1990s, Nauru faced a combination of depleted resources, degraded land (most of the island's interior had been strip-mined), and an import-dependent lifestyle that the remaining economy could not sustain. Nauru's 111% import-to-GDP ratio is the legacy of a resource extraction economy that was never diversified and a land area too small and too damaged to support significant domestic production.
Ireland at 102%: The Corporate Accounting Anomaly
Ireland's 102% import-to-GDP ratio is the most analytically complex figure on the list, and understanding it requires understanding a specific quirk of Irish national accounting that has been widely discussed in economic literature. Ireland's GDP has been significantly inflated in recent years by the activities of multinational corporations (primarily American technology and pharmaceutical companies) that have their European headquarters in Ireland for tax purposes. The profits, intellectual property royalties, and revenue streams of these companies flow through Irish GDP statistics even when the actual economic activity they represent is distributed across Europe and globally.
The Irish Central Statistics Office has acknowledged this distortion and now publishes a modified measure called Modified Gross National Income (GNI*) that attempts to strip out the most distorting elements of multinational activity. When Irish imports are measured as a share of GNI* rather than GDP, the ratio is substantially lower — closer to 60-70% — which is high but consistent with Ireland's status as a small, highly trade-oriented economy integrated into the EU single market. The 102% GDP figure is technically correct but substantively misleading as a measure of Ireland's domestic economy's import dependence. It is, in a sense, the opposite of the entrepôt effect — where Hong Kong's imports are inflated by transit trade, Ireland's denominator is inflated by paper profits.
The Small European States: Luxembourg, San Marino, Malta
Luxembourg (160%), San Marino (155%), and Malta (100%) represent three of the most import-dependent states in Europe, each with different structural explanations. Luxembourg's figure has been covered extensively in prior Prism analysis — it reflects financial sector flows, cross-border commuter consumption, and the EU institutional presence that creates significant imports relative to Luxembourg's value-added GDP. San Marino is a 61-square-kilometre microstate entirely surrounded by Italy, with a population of 34,000 — it has essentially no capacity for domestic production of most goods and functions as an effectively Italian economy with separate political sovereignty. Malta's 100% reflects the combination of an island economy with significant tourism flows (which both generate income and require imports of consumer goods) and a services-oriented economy without significant manufacturing.
The presence of Slovak Republic (86%) and Estonia (75%) further down the list reflects a different phenomenon: small Central and Eastern European EU members whose manufacturing sectors are deeply integrated into European and global supply chains, importing significant quantities of intermediate goods for processing and export. The Slovak Republic is home to Volkswagen, Kia, and Stellantis automobile plants whose production requires substantial imported components, creating high gross import flows relative to the value added domestically. This model — importing components, adding manufacturing value, exporting finished goods — is characteristic of EU accession countries that integrated into German and other Western European supply chains after 2004, and it produces high import-to-GDP ratios that reflect economic integration rather than vulnerability.
Cuba at 82%: Forced Import Dependence
Cuba's 82% import-to-GDP ratio, including the World Bank data's annotation that Cuba imports 70-80% of its food, represents a different category of import dependence from the trading hubs or Pacific islands. Cuba is a large island (109,884 square kilometres — larger than all of the Pacific island states on this list combined) with substantial agricultural potential and a population of approximately 11 million. It should, on geographic grounds, be capable of significant food self-sufficiency. The fact that it imports 70-80% of its food reflects the specific failure of its agricultural system.
Cuba's agricultural sector was reorganised into state farms and cooperatives following the 1959 revolution, dismantling the private farming structure that had previously made Cuba a significant sugar and tobacco exporter. The departure of agricultural managers and capital following nationalisation, combined with the Soviet-era emphasis on sugar monoculture and the collapse of Soviet subsidies in 1991, left Cuban agriculture in chronic underproduction. The U.S. embargo — which restricts purchases of American agricultural goods and the financing terms for food imports from other sources — adds cost and logistical complexity to the import system. Cuba's food import dependence is not geographic inevitability — it is the accumulated result of 65 years of agricultural policy choices whose consequences are measured in a World Bank import statistic.
End of Brief · Prism