THE WORLD ECONOMY REORDERED
Prism · Global Economy
IMF World Economic Outlook · October 2025
THE WORLD
ECONOMY
REORDERED
In 1980, China ranked 7th with a $304 billion economy. In 2025 it ranks 2nd with $19.4 trillion — a 64× expansion. Japan fell from #2 to #4. Argentina and Iran disappeared from the top 20. South Korea, Brazil, Türkiye, Indonesia, and Poland all entered. The global economic order has been rewritten in 45 years, and the rewriting is not finished.
Metric: Nominal GDP in current U.S. dollars (not inflation-adjusted) · IMF World Economic Outlook
U.S. dominance preserved: #1 in both years · $2.9T (1980) → $30.6T (2025) · 10.6× growth
China ascent: #7 in 1980 ($304B) → #2 in 2025 ($19.4T) · +64× · rose 5 positions
Source: IMF · World Economic Outlook October 2025 · GDP figures in current U.S. dollars
U.S. dominance preserved: #1 in both years · $2.9T (1980) → $30.6T (2025) · 10.6× growth
China ascent: #7 in 1980 ($304B) → #2 in 2025 ($19.4T) · +64× · rose 5 positions
Source: IMF · World Economic Outlook October 2025 · GDP figures in current U.S. dollars
Prism Desk·Source: IMF World Economic Outlook·October 2025
Top 20 Economies · 1980 vs 2025 · Nominal GDP · Current USD
Hover rows for detail
Source: IMF WEO Oct 2025
Source: IMF WEO Oct 2025
🇨🇳
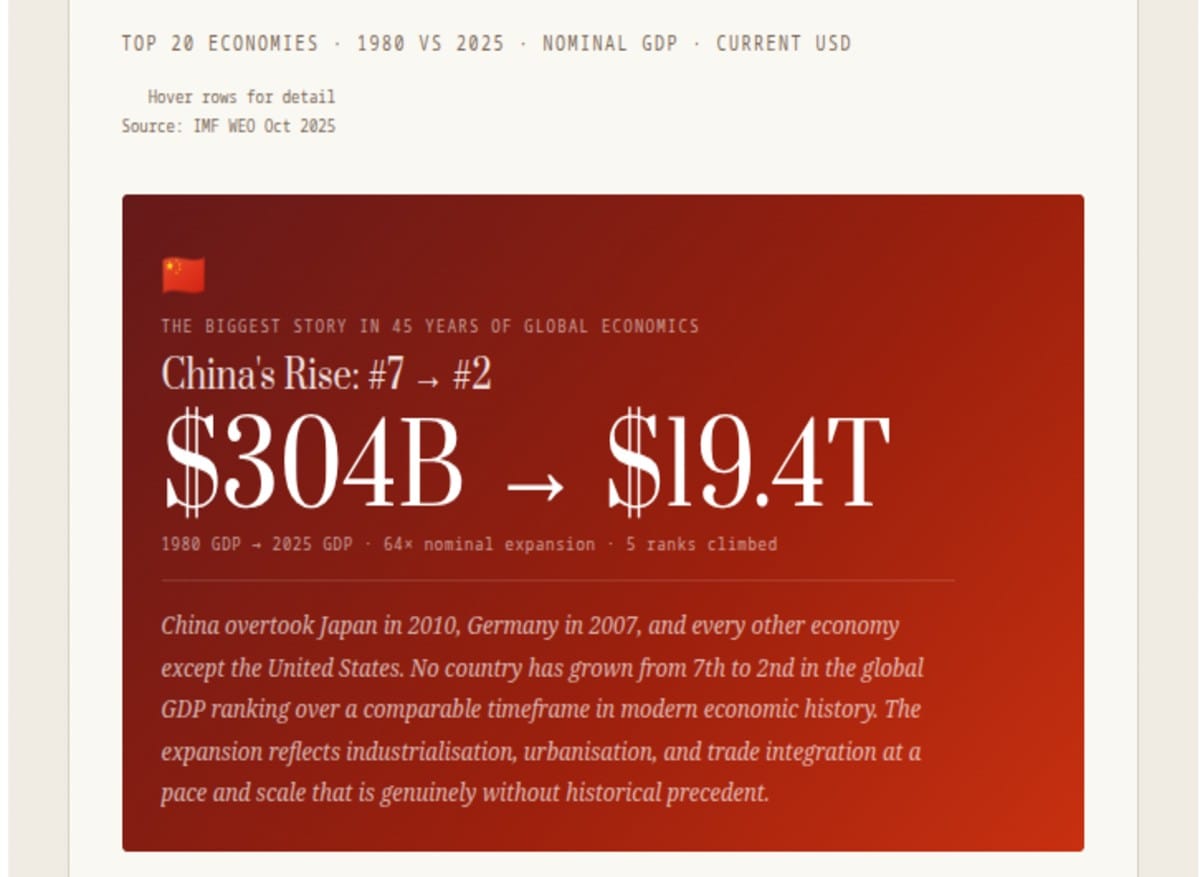
The biggest story in 45 years of global economics
China's Rise: #7 → #2
$304B → $19.4T
1980 GDP → 2025 GDP · 64× nominal expansion · 5 ranks climbed
China overtook Japan in 2010, Germany in 2007, and every other economy except the United States. No country has grown from 7th to 2nd in the global GDP ranking over a comparable timeframe in modern economic history. The expansion reflects industrialisation, urbanisation, and trade integration at a pace and scale that is genuinely without historical precedent.
Rose in ranking
Fell in ranking / exited top 20
Maintained position
New entrant 2025
Side-by-side · 1980 rank → 2025 rank · GDP in current USD
1980CountryGDP
2025CountryGDP
↑ Biggest Risers (rank change)
↓ Fallers & Exits
China's Ascent+5 ranks#7 $304B → #2 $19.4T
64× nominal expansion
Overtook Japan 2010
64× nominal expansion
Overtook Japan 2010
Japan's Decline−2 ranks#2 $1.1T → #4 $4.3T
Absolute growth but
overtaken by China & India
Absolute growth but
overtaken by China & India
New Top 20 (2025)7 newS.Korea · Türkiye · Indonesia
Poland · Russia · Brazil risen
Argentina · Iran · Sweden exited
Poland · Russia · Brazil risen
Argentina · Iran · Sweden exited
Nominal vs. real note: These GDP figures are in current U.S. dollars — not adjusted for inflation. The global price level has risen significantly since 1980, so part of every country's nominal growth is inflation rather than real output expansion. China's 64× nominal expansion reflects both genuine real growth (~35×) and decades of inflation and exchange rate appreciation. The ranking changes are real even accounting for this; the absolute dollar comparisons require a PPP or inflation-adjustment lens for full accuracy.
Source: IMF · World Economic Outlook · October 2025 · GDP figures in current U.S. dollars · Not inflation-adjusted
64×China Nominal
Expansion 1980-2025
Expansion 1980-2025
$30.6TU.S. GDP 2025
Still #1
Still #1
−2Japan's Rank Drop
#2 → #4
#2 → #4
7New Entrants
to Top 20
to Top 20
The 45-Year Reordering
The IMF's World Economic Outlook provides a 45-year before-and-after comparison that is among the most consequential in modern economic data: the top 20 economies in 1980, measured in nominal GDP, and the top 20 in 2025. The comparison reveals a world that has been fundamentally restructured — not by revolution or war, but by the compound effects of economic opening, demographic dividend, industrialisation, and differential productivity growth that have played out at different rates in different countries since the end of Bretton Woods and the beginning of the globalisation era.
The United States maintained first place across the entire period, growing from $2.9 trillion to $30.6 trillion — a 10.6× nominal expansion over 45 years that, while dwarfed in relative terms by China's 64× expansion, represents the sustained output growth of the world's most productive large economy. That the U.S. maintained first place despite China's extraordinary expansion is itself a testament to American economic dynamism: the U.S. economy has generated more nominal GDP growth in absolute terms than any other single country since 1980. The fact that China has caught up to 64% of U.S. GDP in just 45 years from a base of 10% is one of the most extraordinary economic facts of the modern era; the fact that the U.S. has not been overtaken is equally notable.
1980: China at #7, $304 billion. 2025: China at #2, $19.4 trillion. 64× nominal expansion. No economy has climbed from 7th to 2nd in the global ranking over 45 years in modern economic history. The scale of China's transformation does not have a historical precedent to compare it against.
China: From 7th to 2nd
China's trajectory from $304 billion (7th, 1980) to $19.4 trillion (2nd, 2025) is the defining economic story of the last half-century. The nominal expansion of 64× encompasses three distinct phases of Chinese economic development: the agricultural decollectivisation and township-village enterprise phase of the 1980s, which restored price incentives in agriculture and created the first wave of rural industrialisation; the export-led manufacturing phase of the 1990s and 2000s, which converted China's vast labour surplus into the world's manufacturing workshop and drove the extraordinary GDP growth rates of 9-12% annually that persisted for over two decades; and the more recent domestic consumption and technology sector phase of the 2010s and 2020s, which has produced the technology companies (Alibaba, Tencent, Huawei, ByteDance, BYD) and the urban consumer class that represent China's next economic phase.
China overtook Germany in 2007, overtook Japan in 2010 to become #2 for the first time, and has maintained and extended that position since. The remaining gap to the United States — $30.6 trillion vs. $19.4 trillion at market exchange rates — is substantial in nominal terms, but at purchasing power parity China's economy has already exceeded the United States. The nominal vs. PPP distinction is not merely technical: it determines whether China is the world's largest economy today (PPP basis) or still the world's second (market exchange rate basis), and the answer has direct implications for how China's geopolitical weight is assessed.
Japan's Fall: The Cost of Two Lost Decades
Japan's descent from #2 (1980) to #4 (2025) — falling below both China (2010) and India (2025 preliminary) — is the mirror image of China's rise and one of the most significant economic reversals in the post-war period. In 1980, Japan's $1.1 trillion GDP seemed to be on a convergence trajectory toward the United States — the Japanese economic model was being studied worldwide as a potential template for organised capitalist development, and fears of Japanese technological dominance were widespread in American policy circles. Forty-five years later, Japan has been surpassed by China and India and has seen its relative position decline significantly.
The causes of Japan's stagnation — the asset bubble collapse of 1989-1991, the deflation trap of the 1990s and 2000s, the demographic contraction, the failure of structural reform to break through entrenched corporate incumbents — have been analysed exhaustively. What is less often noted is that Japan's absolute GDP has grown from $1.1 trillion to $4.3 trillion — a nearly 4× nominal expansion over 45 years. Japan has not been contracting; it has been growing slowly while China and India have been growing rapidly. Japan's relative decline is the story of what happens when the world grows faster than you: even steady progress can constitute a retreat when the reference frame is moving.
The Exits: Argentina, Iran, Sweden, Belgium, Switzerland
Five countries that appeared in the 1980 top 20 have dropped out of the ranking by 2025: Argentina, Iran, Sweden, Belgium, and Switzerland. Their exits represent entirely different stories. Argentina's exit is a story of repeated economic failure: the country ranked 10th in 1980 with a $234 billion economy, before hyperinflation, debt crises, currency collapses, and chronic political instability compressed its relative economic weight to the point where it no longer qualifies for the top 20 in nominal dollar terms. Iran's exit reflects the comprehensive effects of international sanctions. Sweden, Belgium, and Switzerland's exits are more benign: all three are wealthy countries that have continued growing, but whose moderate-size populations have been overtaken in the nominal GDP rankings by the sheer scale of Asian economies whose populations are orders of magnitude larger.
The New Entrants: A Different World
Seven new countries appear in the 2025 top 20 that were not present in 1980: South Korea, Türkiye, Indonesia, Poland, Russia, and the risen positions of Brazil and India. South Korea's entry reflects one of the most successful directed industrial policy programmes in history. Poland's entry represents the Eastern European economic transformation model at its most successful: EU accession, foreign direct investment absorption, and institutional reform that has produced 30 years of near-continuous economic growth. Indonesia's entry reflects the demographic dividend of the world's fourth most populous country beginning to industrialise seriously.
The most significant new entrant is India — rising from 13th ($186B) in 1980 to 5th ($4.1T) in 2025. India's trajectory is now the most closely watched in global economics: at $4.1 trillion and growing at 6-7% annually, India is both the world's most populous country and one of its fastest-growing large economies. At current growth rates, India will overtake Japan (#4) in the near term and is on a trajectory that, if sustained, will make it one of the three largest economies in the world within the coming decade.
End of Brief · Prism