THE GLOBAL R&D RACE
Prism · Innovation & Science
WIPO · Constant 2015 USD PPP · 2024
THE GLOBAL
R&D
RACE
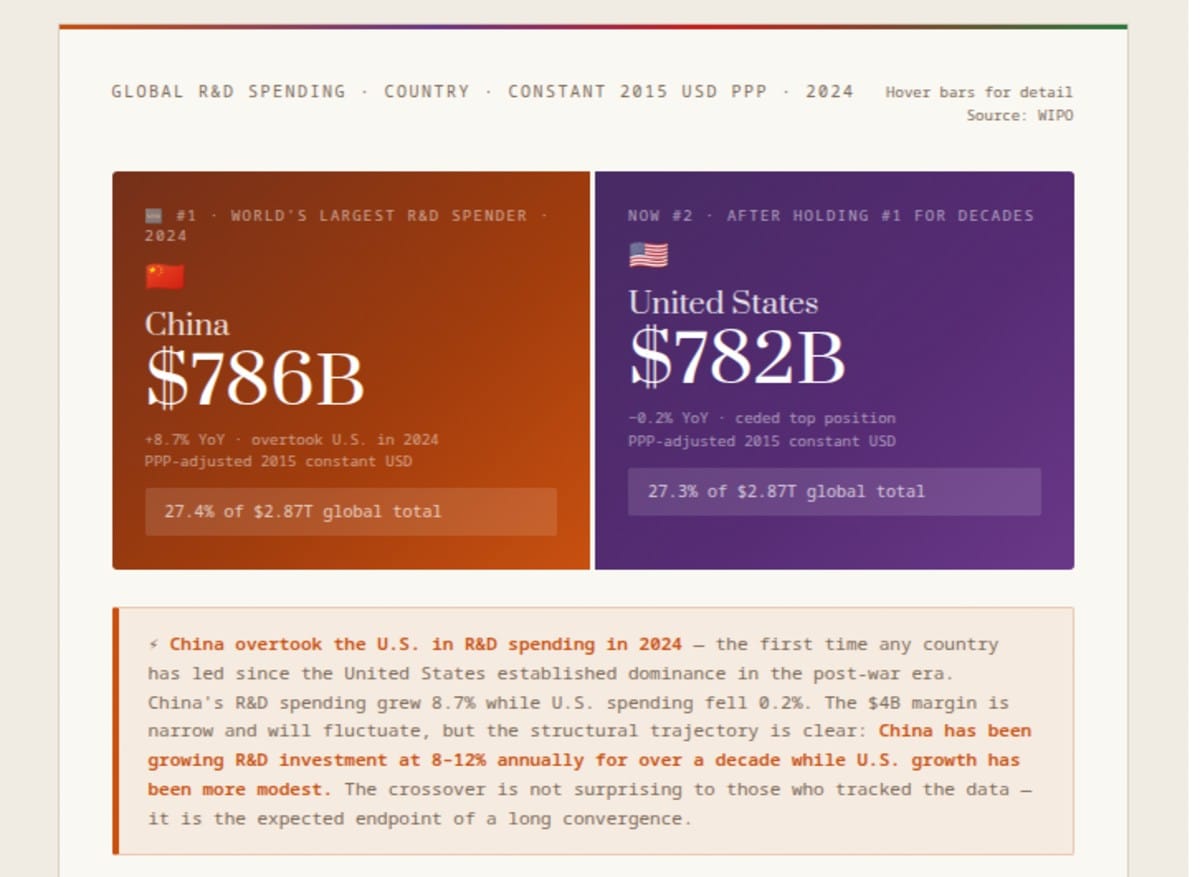
In 2024, China overtook the United States as the world's largest R&D spender — $786B vs. $782B — after China's spending grew 8.7% while American spending fell 0.2%. Global R&D has reached $2.87 trillion. The composition of who spends what, and on what, is the most consequential long-term indicator of technological leadership that exists.
Metric: R&D spending by country · constant 2015 USD adjusted for purchasing power parity (PPP) · 2024
Global total: $2.87 trillion · China $786B (#1) · U.S. $782B (#2) · Japan $186B (#3)
Crossover: China overtook U.S. in 2024 — China +8.7%, U.S. −0.2%
Source: World Intellectual Property Organization (WIPO) · Latest available as of Jan 2026 · Figures rounded
Global total: $2.87 trillion · China $786B (#1) · U.S. $782B (#2) · Japan $186B (#3)
Crossover: China overtook U.S. in 2024 — China +8.7%, U.S. −0.2%
Source: World Intellectual Property Organization (WIPO) · Latest available as of Jan 2026 · Figures rounded
Prism Desk·Source: WIPO·2024
Global R&D Spending · Country · Constant 2015 USD PPP · 2024
Hover bars for detail
Source: WIPO
Source: WIPO
🆕 #1 · World's Largest R&D Spender · 2024
🇨🇳
China
$786B
+8.7% YoY · overtook U.S. in 2024
PPP-adjusted 2015 constant USD 27.4% of $2.87T global total
PPP-adjusted 2015 constant USD 27.4% of $2.87T global total
Now #2 · after holding #1 for decades
🇺🇸
United States
$782B
−0.2% YoY · ceded top position
PPP-adjusted 2015 constant USD 27.3% of $2.87T global total
PPP-adjusted 2015 constant USD 27.3% of $2.87T global total
⚡ China overtook the U.S. in R&D spending in 2024 — the first time any country has led since the United States established dominance in the post-war era. China's R&D spending grew 8.7% while U.S. spending fell 0.2%. The $4B margin is narrow and will fluctuate, but the structural trajectory is clear: China has been growing R&D investment at 8–12% annually for over a decade while U.S. growth has been more modest. The crossover is not surprising to those who tracked the data — it is the expected endpoint of a long convergence.
$2.87TGlobal R&D
2024 total
2024 total
R&D spending by region · approximate 2024
China's Ascent+8.7%$786B · #1 in 2024
Decade of 8–12% annual growth
State-directed industrial R&D
Decade of 8–12% annual growth
State-directed industrial R&D
East Asian Bloc$1.1TChina $786B · Japan $186B
S.Korea $126B · India $76B
~38% of global R&D
S.Korea $126B · India $76B
~38% of global R&D
European Cluster$456BGermany $132B · UK $87B
France $66B · Russia $38B
~16% of global total
France $66B · Russia $38B
~16% of global total
PPP note: These figures use constant 2015 USD adjusted for purchasing power parity — meaning a dollar of R&D in China and a dollar in the U.S. are treated as buying equivalent research inputs, not measured at market exchange rates. At market exchange rates, U.S. R&D spending still exceeds China's by a wider margin, because Chinese wages and laboratory costs are lower than American equivalents. The PPP adjustment is the methodologically appropriate comparison for measuring research activity; the market exchange rate comparison is more relevant for technology transfer and international competitive dynamics.
Source: World Intellectual Property Organization (WIPO) · Constant 2015 USD PPP · 2024 · Latest available as of Jan 2026 · Figures rounded
$786BChina
#1 R&D 2024
#1 R&D 2024
$782BUnited States
Now #2
Now #2
$2.87TGlobal R&D
Total 2024
Total 2024
+8.7%China YoY Growth
vs. U.S. −0.2%
vs. U.S. −0.2%
The Crossover That Was Predicted for a Decade
The World Intellectual Property Organization's 2024 R&D spending data confirms what analysts who tracked the numbers had anticipated for years: China has surpassed the United States as the world's largest spender on research and development, at $786 billion to $782 billion on a purchasing-power-parity-adjusted basis. The margin is narrow — approximately 0.5% — and will fluctuate as both countries' spending trajectories evolve. But the structural significance of the crossover is independent of the specific margin: it represents the first time since the post-World War II era that the United States has not led the world in absolute R&D investment, and it signals the maturation of a Chinese innovation system that has been under construction for three decades.
The crossover itself was not a sudden event. China's R&D spending has grown at 8-12% annually for over a decade while U.S. growth has been more modest, driven by a combination of government-directed investment (China's 14th Five-Year Plan explicitly targets R&D intensity at 2.5% of GDP) and the rapid scaling of private sector technology companies (Huawei, Alibaba, Tencent, ByteDance) whose research expenditures have become significant components of the total. The United States' slight decline of 0.2% in 2024 reflected the pullback of several major technology companies from aggressive research expansion following the 2021-2023 tech sector correction, combined with the effects of higher interest rates on R&D investment decisions. The narrow margin at the crossover point should not obscure the directionality: China has been growing faster for longer, and the crossing was when, not if.
China overtook the U.S. in R&D in 2024. This was not a surprise — it was the expected endpoint of a 15-year convergence trajectory. The question was never whether the crossing would happen. It was what kind of R&D the crossed lines represent.
What the PPP Adjustment Reveals and Obscures
The WIPO figures are presented in constant 2015 USD adjusted for purchasing power parity — a methodological choice that significantly affects the ranking. PPP adjustment attempts to account for the fact that the same dollar buys different quantities of research inputs in different countries: a postdoctoral researcher in Shanghai earns substantially less in dollar terms than an equivalent researcher at MIT, but both perform research. PPP adjustment treats these as equivalent by adjusting for the relative cost of a standardised basket of research inputs.
The consequence of this adjustment is that it brings China's nominal spending (at market exchange rates, China's R&D in yuan converts to approximately $450-500 billion at 2024 exchange rates) up to parity with U.S. spending. In market exchange rate terms, the United States still leads China by a significant margin — approximately 55-60% above China's nominal USD equivalent. The distinction matters for understanding what different R&D spending figures mean: PPP-adjusted figures measure the volume of research activity; market exchange rate figures measure the economic value transferable in international markets. China is doing more research (by PPP measure) but the global economic value of that research — its weight in international licensing, publication citation, and technology export — is still contested.
Japan at $186B: The Long Decline in Relative Terms
Japan's $186 billion in R&D spending maintains its position as the world's third largest spender, but the relative decline from Japan's position in the 1990s is striking. Japan was once seen as the primary challenger to American technological leadership — the combination of Toyota's manufacturing methods, Sony's consumer electronics dominance, NEC and Fujitsu's semiconductor ambitions, and the keiretsu R&D model produced genuine fears in Washington in the late 1980s that Japan would lead the next wave of global technology. The Plaza Accord (1985), the asset bubble collapse (1989-1991), and two subsequent "lost decades" of minimal growth substantially deflated Japan's technological ambitions and its R&D growth trajectory.
Japan's $186B figure, however, understates its technological contribution in specific high-value sectors. Japan dominates global production of certain semiconductor equipment (Tokyo Electron, Shin-Etsu Chemical, Sumco), advanced materials (carbon fibre, specialty chemicals), and precision manufacturing equipment that are irreplaceable inputs to the global technology supply chain. Japan's R&D is concentrated and deep in specific verticals rather than broad across all technology domains — a different innovation model from the American or Chinese approach of breadth across sectors.
South Korea at $126B: Concentrated Excellence
South Korea's $126 billion represents the highest R&D intensity (R&D as a percentage of GDP) of any major economy in the world — exceeding 4.9% of GDP in recent years, compared to approximately 3.4% for the United States and 2.4% for the European Union. This extraordinary R&D intensity reflects the specific structure of the Korean economy, which is dominated by a small number of large conglomerates (Samsung, SK Group, LG, Hyundai) that have made technology investment central to their competitive strategy in global markets where they compete directly against Japanese, European, and American incumbents.
Samsung Electronics alone spends approximately $20-22 billion annually on R&D — more than most countries — and has used this investment to move from a fast-follower technology model in the 1980s to a genuine technology leader in semiconductors (memory and foundry), displays, and consumer electronics. South Korea's overall R&D intensity is the product of industrial policy that deliberately channelled national savings into a handful of large companies and forced them to compete globally, creating the financial incentive for sustained R&D investment that smaller domestic markets could not provide.
India at $76B: The Development Trajectory
India's $76 billion in R&D spending is the most significant figure in the dataset for understanding the future trajectory of global R&D distribution. India's R&D intensity — approximately 0.65% of GDP — is low by the standards of major economies, far below China (2.4%), South Korea (4.9%), or the United States (3.4%). But India has the second largest population in the world, a rapidly growing technology sector, and a government that has explicitly identified R&D investment as a strategic priority in its economic planning frameworks.
The trajectory story for India is more important than the current absolute figure. India's R&D spending has been growing at approximately 10-12% annually over the recent period, driven by growth in the private technology sector (Infosys, Wipro, TCS, and dozens of smaller technology companies), government space (ISRO) and defence research investment, and pharmaceutical R&D (India is the world's largest producer of generic medicines by volume, and generic pharmaceutical development requires significant but lower-cost R&D). At current growth rates, India's R&D spending will double within 7-8 years — a trajectory that will place it among the top 5 global R&D spenders by the early 2030s.
India at 0.65% R&D intensity vs. China's 2.4% and South Korea's 4.9%. The gap is enormous — but the trajectory matters more than the snapshot. At 10-12% annual growth, India doubles its R&D in under 8 years. The composition of global innovation leadership in 2035 will look different from today.
Europe's $456B: Strength in Specific, Weakness in Scale
Europe's combined R&D spending — Germany $132B, UK $87B, France $66B, Russia $38B, Italy $33B, Netherlands $23B, Sweden $20B, Belgium $20B, Switzerland $21B, and others — totals approximately $456 billion, representing roughly 16% of global R&D. European R&D produces world-leading outcomes in specific sectors: automotive technology (Germany), pharmaceuticals (UK, Switzerland, Germany), aerospace (France, UK, Germany through Airbus), and specialty materials. But Europe's aggregate R&D figure is somewhat misleading because it includes the UK (post-Brexit, only partially integrated with EU research frameworks), Russia (largely isolated from Western science since 2022), and small nations like Switzerland whose R&D is very high quality but domain-specific.
The European Union's structural R&D challenge is different from the individual country level: the EU's Horizon Europe programme attempts to coordinate R&D investment across 27 member states but has struggled to produce the kind of scale integration that American or Chinese national R&D programmes achieve within single political entities. European researchers work across borders more than they did 30 years ago, but the national funding and regulatory fragmentation that characterises European innovation policy creates transaction costs that reduce the efficiency of European R&D relative to equivalent spending in more integrated systems.
What R&D Spending Predicts and What It Doesn't
R&D spending is a leading indicator of technological capability with a long and variable lag: money invested in research today produces technological products, patents, and publications over a 5-20 year horizon, depending on the technology domain. The semiconductor wafer whose specification sheet exists today required R&D investments made in the late 2010s. The pharmaceutical compound in Phase III clinical trials today required discovery research from the early 2010s. This long lag means that the R&D spending distribution of 2024 is predicting the technology leadership landscape of the late 2020s and 2030s, not of next year.
The prediction is complicated by several factors that spending alone doesn't capture. R&D quality varies enormously: spending on replicating existing technology produces different value from spending on genuinely novel research. The United States' advantage in producing Nobel Prize-winning research, patent-intensive technology companies, and breakthrough scientific publications remains substantial even as China's spending matches American levels. The composition of Chinese R&D — which is relatively more weighted toward applied engineering and less toward basic science than American R&D — suggests a continued American advantage in the most unpredictable and potentially most valuable frontier research, even as China's applied technology capabilities converge and in some domains exceed American equivalents.
The 2024 R&D crossover is the most significant data point in global science and technology policy in a generation. It marks the formal end of the American monopoly on scientific and technological investment leadership that has held since the Marshall Plan era. Whether the crossover translates into Chinese technological supremacy, or whether the quality, institutional, and commercialisation advantages that the American system retains are sufficient to maintain practical leadership in the sectors that matter most — AI, semiconductors, biotechnology, advanced materials — is the defining empirical question for the global technology competition of the next two decades.
End of Brief · Prism