States with the Fastest-Rising Incomes 2019–2024
Prism · Labour Economics & Income · United States
States with the
Fastest-Rising
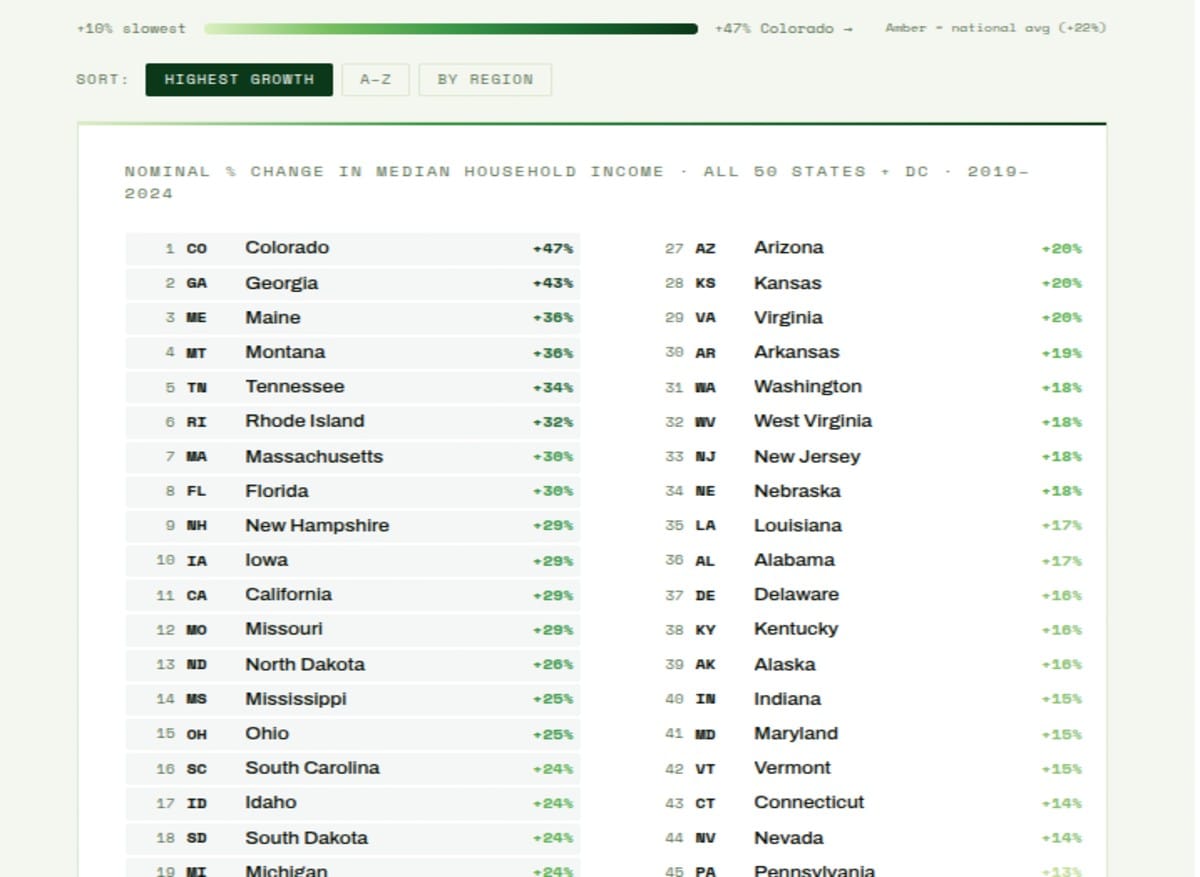
Incomes 2019–2024 Nominal change in median household income. Colorado surged +47% — driven by tech employment growth. North Carolina and Oklahoma saw just +10%. The US overall rose +22%. The gap between fastest and slowest is a map of economic geography, not just luck.
Fastest-Rising
Incomes 2019–2024 Nominal change in median household income. Colorado surged +47% — driven by tech employment growth. North Carolina and Oklahoma saw just +10%. The US overall rose +22%. The gap between fastest and slowest is a map of economic geography, not just luck.
+47%
Colorado — Fastest
+22%
U.S. Overall
+10%
NC / OK — Slowest
Fastest Rising
Slowest Rising
+10% slowest
+47% Colorado →
Amber = national avg (+22%)
Sort:
Nominal % Change in Median Household Income · All 50 States + DC · 2019–2024
Amber marker = U.S. national average (+22%) · Nominal change, not inflation-adjusted · Source: U.S. Census Bureau
+47%
Colorado
Tech job growth 2018–2023 led all sectors in state
Tech job growth 2018–2023 led all sectors in state
+43%
Georgia
Corporate relocations + logistics + film industry
Corporate relocations + logistics + film industry
+22%
U.S. Overall
Nominal — real gain after 21% CPI rise is modest
Nominal — real gain after 21% CPI rise is modest
+10%
NC / OK
Slowest — below inflation for most of the period
Slowest — below inflation for most of the period
Nominal vs Real: The 22% That Wasn't
The U.S. median household income rose 22% nominally between 2019 and 2024 — a headline figure that implies substantial income progress. The critical context is inflation: the Consumer Price Index rose approximately 21–23% over the same period, meaning that the national median household income in real purchasing power terms was approximately flat over five years. For states at or below the national average — particularly the 10% gainers like North Carolina, Oklahoma, Hawaii, Illinois, and Washington D.C. — nominal gains of 10–13% represent real income declines of 8–12% against the inflation experienced over the period. The geography of income growth in this dataset is, in real terms, a map of which states protected their residents' living standards and which did not.
The distinction matters politically and economically. Households experiencing nominal wage increases often perceive themselves as better off even when purchasing power has declined — a money illusion that has characterised much of the post-pandemic period. The states with the largest nominal gains — Colorado, Georgia, Maine, Montana, Tennessee — may have genuinely delivered real income improvements to their median households, particularly if their local inflation rates were below the national average. But the states at the bottom of the nominal ranking almost certainly experienced real income contraction, creating the economic anxiety that has driven political volatility in affected communities even in the context of ostensibly low unemployment.
Colorado's median household income rose 47% nominally between 2019 and 2024. National inflation over the same period was approximately 21–23%. Colorado's real income gains were among the largest in the country — driven not by luck but by deliberate tech sector development that created high-wage employment at scale.
Colorado's Tech Dividend
Colorado's +47% is the highest in the dataset by a four-percentage-point margin over Georgia (+43%), and its explanation is specific: the state's technology sector added more jobs than any other industry between 2018 and 2023, pulling median household income sharply upward as high-compensation tech employment became a larger share of the state workforce. Denver and the Front Range corridor — Boulder, Fort Collins, Colorado Springs — developed into a significant technology hub over the 2010s, attracting both technology company headquarters (Oracle relocated its headquarters from California to Austin and Denver in 2020–2021) and remote workers from San Francisco, Seattle, and New York who brought high incomes with them but settled in a lower-cost environment. The Colorado story is a compounding one: the existing tech base attracted more tech workers, which raised median incomes, which attracted more service businesses, which created additional employment. The 47% nominal gain reflects approximately three years of accelerated tech sector growth plus the broad wage increases of the 2021–2022 tight labour market period.
The housing market consequence of this income growth is the other side of the Colorado story. Denver's median home price rose from approximately $340,000 in 2019 to over $550,000 by 2024 — an increase that consumed much of the nominal income gain for households seeking to enter homeownership. Colorado's high nominal income growth has simultaneously made the state richer on average and less affordable at the median — a pattern that characterises most of the highest-income-growth states in this dataset and explains the political complexity of "economic success" in a housing-constrained environment.
Georgia's Corporate Relocation Premium
Georgia's +43% — second nationally — reflects a different growth driver than Colorado's organic tech development: deliberate corporate relocation and industrial attraction policy. Georgia has positioned itself as the Southeast's business-friendly alternative to higher-cost Northeast and West Coast states, offering competitive corporate tax rates, the Hartsfield-Jackson Atlanta hub as a global logistics centre, a large and diversified labour market, and state-level incentive programmes that have attracted major employers. The film industry's expansion in Georgia — which now rivals California and New York for major productions — has added a significant entertainment sector payroll. The electric vehicle supply chain has been particularly transformative: Hyundai's Metaplant in Bryan County, Rivian's plant in Normal, Illinois (but with Georgia supply chain investment), and multiple battery manufacturing investments have created high-wage manufacturing employment in a state where manufacturing had previously declined.
The Slow-Growth States: Structure, Not Stagnation
North Carolina and Oklahoma's +10% — the lowest in the dataset — reflect structural economic features rather than policy failure alone. North Carolina's modest income growth is somewhat counterintuitive given the Research Triangle's well-publicised technology and pharmaceutical sector expansion: the state attracted significant investment from Apple, Google, and multiple semiconductor companies. The explanation is compositional: North Carolina's overall income distribution is broad and includes large rural areas, agricultural regions, and legacy manufacturing communities where wage growth was modest or negative, pulling the statewide median down even as the Triangle's high earners saw substantial gains. The statewide median captures not just the Research Triangle's experience but the entire state — and for most North Carolinians not in the Triangle, the period was one of modest nominal and potentially negative real income growth.
Washington D.C.'s +13% is perhaps the most surprising figure in the dataset. The District is the highest-income jurisdiction in the country by per-capita income, home to the federal government's highest-paid employees, a booming technology and consulting sector, and a rapidly gentrifying real estate market. The 13% nominal gain — below the national average — reflects composition: D.C.'s median household includes a large low-income population in Wards 7 and 8 that experienced modest wage gains, pulling the citywide median down from what the upper-income wards' experience would suggest. The D.C. figure is a reminder that median income change reflects the full distribution, not just the experience of the most economically dynamic sectors of a jurisdiction.
End of Brief · Prism