Foreign-Born Population by State
Prism · Immigration & Demography · United States
Foreign-Born
Population
by State 14.8% of the U.S. population — 50.2 million people — was born abroad. California leads at 27.7%; Montana and West Virginia trail at 2.1%. The geographic distribution of America's immigrant population is a map of labour markets, networks, and opportunity.
Population
by State 14.8% of the U.S. population — 50.2 million people — was born abroad. California leads at 27.7%; Montana and West Virginia trail at 2.1%. The geographic distribution of America's immigrant population is a map of labour markets, networks, and opportunity.
50.2M
14.8% of all Americans were born outside the United States — the highest share in over a century. The range across states runs from 27.7% in California to 2.1% in Montana and West Virginia.
2.1% Montana / WV
27.7% California →
Amber = national avg (14.8%)
Sort:
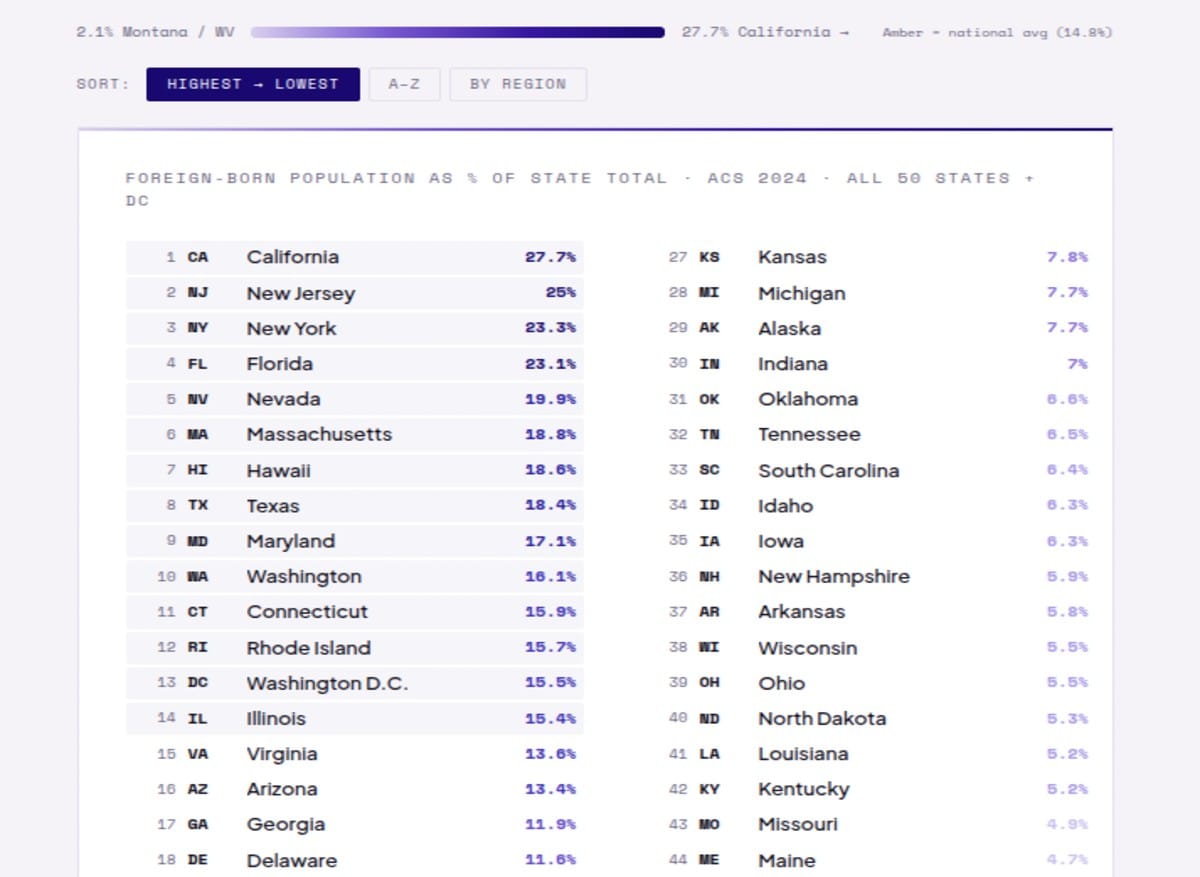
Foreign-Born Population as % of State Total · ACS 2024 · All 50 States + DC
Amber marker = national average (14.8%) · Source: U.S. Census Bureau, American Community Survey 2024 1-Year Estimates
27.7%
California
Highest — more than 1 in 4 residents born abroad
Highest — more than 1 in 4 residents born abroad
50.2M
Total foreign-born
Highest share in more than a century at 14.8%
Highest share in more than a century at 14.8%
6 states
Above 20%
CA, NJ, NY, NV, FL, HI — gateway metros
CA, NJ, NY, NV, FL, HI — gateway metros
2.1%
Montana / West Virginia
Lowest — rural, inland, limited migration networks
Lowest — rural, inland, limited migration networks
The Geography of Immigrant Settlement
The foreign-born share of the U.S. population at 14.8% is not distributed randomly across 50 states — it is concentrated in specific economic geographies with striking precision. California (27.7%), New Jersey (25.0%), New York (23.3%), Florida (23.1%), and Nevada (19.9%) lead the dataset because they share a cluster of characteristics that have historically attracted immigrant settlement: major port cities with established ethnic communities, diverse labour markets with both high-skill and low-skill employment opportunities, international airports that reduce the physical friction of arrival, and the cultural infrastructure — ethnic enclaves, multilingual services, community organisations — that makes initial settlement feasible for people arriving in an unfamiliar country. Immigration follows networks, not maps. The probability that a person from a given country will settle in a particular US city or state is disproportionately determined by whether someone from their community is already there — a path-dependence that has sustained the concentration of immigrant populations in gateway states across multiple generations.
Texas's 18.4% and Hawaii's 18.6% represent different immigration stories. Texas's foreign-born population is concentrated in border communities (El Paso, Laredo, the Rio Grande Valley) and in the major metropolitan areas of Houston, Dallas, Austin, and San Antonio, which have attracted both low-skill labour migrants and high-skill technology and professional workers. Hawaii's 18.6% reflects the state's Pacific geography — its proximity to Asia and its history as a destination for Japanese, Filipino, Korean, and Chinese labour migrants going back to the plantation era — overlaid with contemporary immigration from the Philippines, Japan, and Korea.
The states with the lowest foreign-born shares are not more "American" — they are less connected to the global migration networks that channel immigrant settlement. Montana at 2.1% is not an immigration success story; it is an economic geography that has not generated the labour demand or community infrastructure that attracts settlement.
The High-Immigration States: Gateway Economics
The six states above 20% foreign-born — California, New Jersey, New York, Nevada, Florida, and Hawaii — are each anchored by specific economic functions that generate sustained immigrant demand. New Jersey's 25.0% reflects its role as an extension of the New York metro labour market, with suburban communities that have attracted Indian, Korean, Chinese, and Latin American immigrants who work in the tri-state professional economy while settling in more affordable communities than Manhattan or the inner boroughs. New York's 23.3% reflects the city's continuing function as the primary gateway for immigrants from the Caribbean, South America, China, South Asia, and Eastern Europe. Florida's 23.1% is disproportionately driven by Cuban, Venezuelan, Colombian, and Brazilian immigration to the South Florida metro, which has become the effective capital of Latin American diaspora in the United States — a hub of business, media, and cultural institutions oriented toward Latin America that generates continuous immigration demand independent of conditions in individual countries of origin.
Nevada's 19.9% reflects the specific labour demands of the Las Vegas economy — hospitality, construction, healthcare, and food service — which have historically recruited heavily from Mexico, the Philippines, and Central America. Las Vegas has one of the highest concentrations of undocumented immigrants of any major US metro, reflecting the casino and hospitality industries' historical tolerance for undocumented labour in back-of-house roles. The political irony is that Nevada — a state whose economy is structurally dependent on immigrant labour in ways that even congressional Republicans have historically acknowledged — has periodically been represented by politicians at the forefront of immigration restriction advocacy.
The Midwest and Interior West: The Low End
Montana (2.1%), West Virginia (2.1%), Mississippi (2.7%), and Wyoming (3.5%) anchor the low end of the distribution — states with relatively homogeneous populations, limited immigration histories, and economic structures that have not historically generated the labour demands or urban infrastructure that attract immigrant settlement. This does not mean these states have no immigrant communities — meatpacking plants in rural Kansas (7.8%), poultry processing facilities in Arkansas (5.8%), and agricultural operations across the interior West have created specific immigrant communities in unexpected locations. But the statewide averages remain low because the total size of the labour markets in these states is small and geographically dispersed.
The Midwest interior — Iowa (6.3%), Nebraska (9.0%), Kansas (7.8%), Missouri (4.9%) — shows a wider range driven by specific industrial immigration to food processing and meatpacking industries. Nebraska's 9.0% is higher than many observers would expect, driven by Omaha's substantial immigrant population in meatpacking and healthcare, and by the historic settlement of Latino, Somali, and South Sudanese communities in specific meatpacking towns like Schuyler, Lexington, and Grand Island. These interior immigrant communities represent the "second wave" of US immigration history — a geographic diffusion of immigrant settlement from the traditional gateway metros toward inland industrial towns that has been a consistent trend since the 1990s and has accelerated as coastal housing costs have become prohibitive even for lower-wage immigrant workers.
The 14.8% in Historical Context
The national foreign-born share of 14.8% is frequently described as the highest in American history — an assertion that is approximately correct but requires a qualifier. The 1910 census recorded a foreign-born share of approximately 14.7%, and various estimates for the 1890s suggest comparable levels driven by the peak of European mass migration. What makes the current figure historically unusual is not its absolute level but its composition and the political context in which it has emerged. The early 20th-century immigrant wave was followed by the Immigration Act of 1924, which dramatically reduced immigration from Eastern and Southern Europe and essentially eliminated it from Asia — a deliberate demographic engineering effort that reduced the foreign-born share from 14.7% to approximately 4.7% by 1970. The immigration reform of 1965, which replaced national-origin quotas with a preference system for family reunification and skills, initiated a five-decade recovery that has returned the foreign-born share to early 20th-century levels.
The political salience of the 14.8% figure — and the Trump administration's immigration enforcement priorities — reflect a recurring American tension between the economic benefits of immigration (labour supply, entrepreneurship, innovation, demographic replacement of an aging native-born population) and the cultural and political anxieties that accompany rapid demographic change. This tension is not new: every major wave of American immigration has generated nativist political movements that eventually moderated as the immigrant generation assimilated and the subsequent generation became fully American. Whether the current political environment represents a temporary intensification of a recurring cycle or a more durable structural shift in American immigration policy remains the most contested political question in this data.
End of Brief · Prism