Economies with the Largest Ecological Footprints
Prism · Sustainability & Trade · Hinrich Foundation / IMD STI 2025
Economies with the
Largest Ecological
Footprints Singapore consumes 10.07 global hectares per person — Bangladesh just 0.68. The Ecological Footprint of Consumption measures how much productive land and water a population's lifestyle requires. This is the environmental dimension of who trades sustainably.
Largest Ecological
Footprints Singapore consumes 10.07 global hectares per person — Bangladesh just 0.68. The Ecological Footprint of Consumption measures how much productive land and water a population's lifestyle requires. This is the environmental dimension of who trades sustainably.
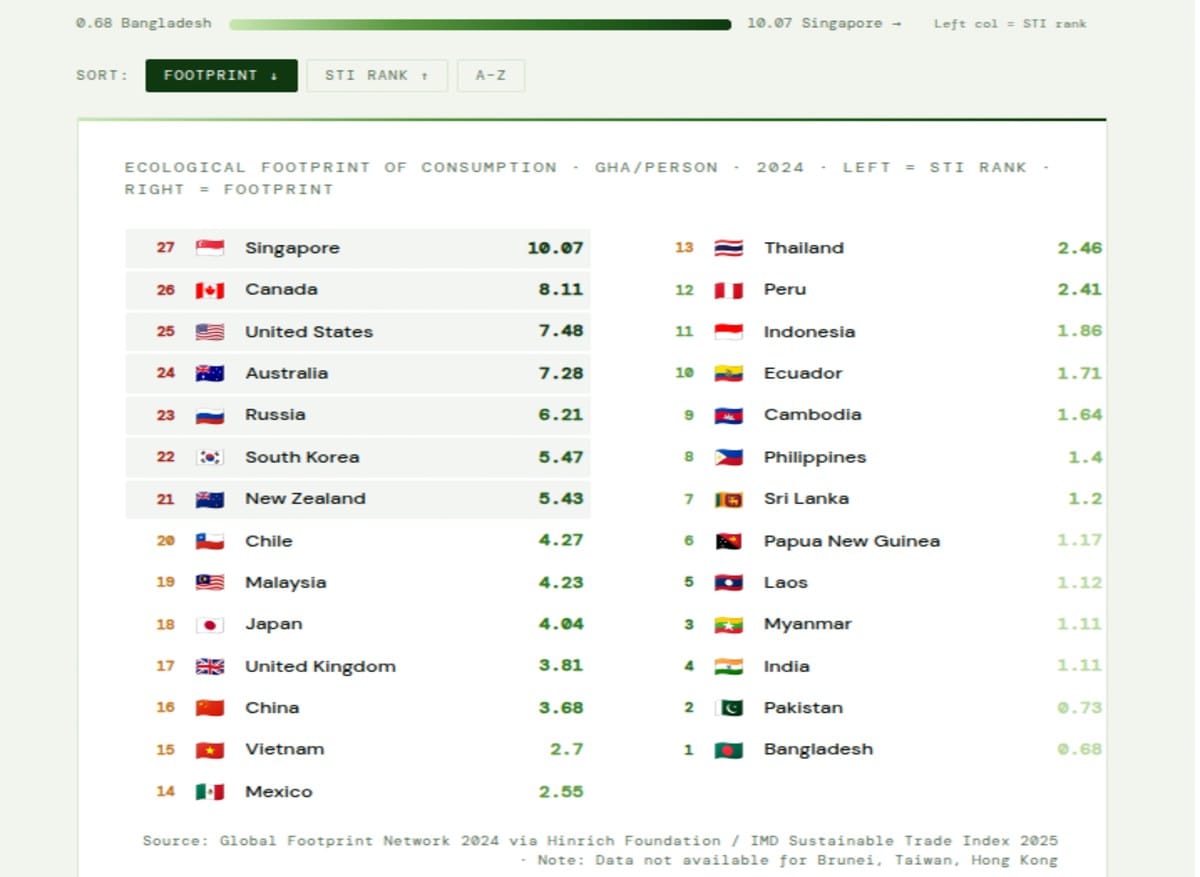
Ecological Footprint of Consumption tracks the amount of productive land and water required to sustain a population's resource use and absorb its waste — measured in global hectares (gha) per person. It is one of 17 environmental indicators in the Sustainable Trade Index.
Largest Footprint
10.07
🇸🇬 Singapore
gha/person · Dense, import-dependent city-state
Global Average (approx.)
~2.8
🌍 World
gha/person · Singapore is 3.6× world average
Smallest Footprint
0.68
🇧🇩 Bangladesh
gha/person · #1 STI rank · Low-consumption economy
0.68 Bangladesh
10.07 Singapore →
Left col = STI rank
Sort:
Ecological Footprint of Consumption · gha/person · 2024 · Left = STI Rank · Right = Footprint
Source: Global Footprint Network 2024 via Hinrich Foundation / IMD Sustainable Trade Index 2025 · Note: Data not available for Brunei, Taiwan, Hong Kong
Paradox Watch · High STI Rank (Sustainable Trade) vs High Ecological Footprint
STI Rank = performance on Sustainable Trade Index (lower = more sustainable) · Footprint = gha/person consumed
10.07
Singapore
Dense import economy — footprint 14.8× Bangladesh
Dense import economy — footprint 14.8× Bangladesh
8.11
Canada
Energy-intensive economy · high per-capita footprint
Energy-intensive economy · high per-capita footprint
0.68
Bangladesh
#1 STI rank · Lowest footprint — structural poverty vs choice
#1 STI rank · Lowest footprint — structural poverty vs choice
14.8×
Gap
Between Singapore (10.07) and Bangladesh (0.68)
Between Singapore (10.07) and Bangladesh (0.68)
What a Global Hectare Buys
The Ecological Footprint of Consumption is not a measure of a country's environmental policy intent — it is a measure of the biocapacity required to sustain its population's actual resource use and absorb its waste. One global hectare (gha) represents one hectare of land or water with average global biological productivity; the footprint metric asks how many of those hectares per person a country's consumption implies. Singapore's 10.07 gha per person means that sustaining a Singaporean's lifestyle requires the equivalent of 10.07 hectares of land producing at average global productivity — a demand that no city-state of Singapore's density can come close to meeting from its own territory. The difference between what Singapore's territory can regenerate and what its population consumes is imported — in food, energy, materials, and the waste absorption capacity of ecosystems elsewhere.
The ecological footprint framework, developed by the Global Footprint Network, is methodologically contested — critics argue that it conflates biocapacity supply and demand in ways that obscure important distinctions, and that its treatment of carbon absorption capacity is particularly uncertain. But its core insight is robust: resource consumption has a biophysical basis, and wealthy, dense, energy-intensive economies systematically require more of the Earth's productive capacity per person than poor, rural, low-energy economies. The 14.8-fold gap between Singapore's 10.07 and Bangladesh's 0.68 is not primarily an environmental policy gap — it is a development gap and a consumption gap that reflects the entire economic distance between a high-income city-state and a lower-middle-income agrarian economy.
Bangladesh ranks first on the Sustainable Trade Index and has the lowest ecological footprint in the dataset. Singapore ranks 27th and has the highest. The uncomfortable question is how much of Bangladesh's sustainability reflects deliberate conservation — and how much reflects the absence of the consumption that wealth enables.
Singapore's Import-Dependent Paradox
Singapore's 10.07 gha per person is the highest in the Hinrich Foundation's STI dataset — higher than Canada (8.11), Australia (7.28), and the United States (7.48). The explanation lies in Singapore's specific economic structure. Singapore is a city-state of 5.9 million people on 730 square kilometres with effectively no agriculture, no significant forestry, and very limited natural resources. Almost everything Singaporeans consume — food, water (partially), manufactured goods, building materials, fuel — must be imported. The country's world-class port handles approximately 37 million TEUs annually, routing goods not just for Singaporean consumption but for regional distribution — but the footprint metric captures consumption rather than transit, so transit goods are excluded. Singapore's high footprint reflects genuine consumption by a wealthy, urbanised population with high per-capita income, high protein diets, extensive air conditioning, and significant air travel.
The Sustainable Trade Index places Singapore 27th — lowest in the dataset — despite its obvious strengths in rule of law, trade facilitation, and financial infrastructure. The environmental pillar, of which footprint is a component, significantly depresses Singapore's overall rank. This creates a genuine policy tension for Singapore's leadership: the city-state has invested significantly in environmental infrastructure (water recycling, solar energy, green building standards, urban greenery programmes) and has ambitious sustainability targets, but its fundamental economic model — intensive trade facilitation and high-value consumption by a wealthy population — creates an ecological demand that policy interventions at the margin cannot fundamentally alter without changing the economic structure itself.
The US, Canada, and Australia: Resource-Rich Overconsumers
The United States (7.48 gha/person), Canada (8.11), and Australia (7.28) cluster together as resource-rich, wealthy economies with large ecological footprints that reflect similar drivers: energy-intensive economies with high vehicle ownership and per-capita car travel, large living spaces that require significant heating and cooling, high-protein Western diets, substantial air travel, and material consumption patterns shaped by relatively low commodity prices that have historically not reflected ecological costs. The United States and Canada are both net exporters of ecological capacity in certain categories — they export grain, timber, and other bioproducts in quantities that exceed domestic consumption — but their per-capita footprints remain large because the consumption side of the ledger is dominated by energy use and lifestyle-related consumption that offsets their biocapacity advantages.
Australia's 7.28 is perhaps the most striking among comparable economies given the country's relatively small population and vast territory. Australia has extraordinarily high per-capita biocapacity — one of the highest in the world given its land area — but its consumption footprint similarly reflects an energy-intensive economy, long internal travel distances, high vehicle dependence, and the consumption patterns of a wealthy Anglophone society that mirrors US and Canadian patterns more than European ones. The footprint metric treats Australia as a net ecological debtor despite its resource wealth — a result that Australian environmental economists frequently challenge as overstating demand relative to the country's genuinely large biocapacity endowment.
The Low-Footprint Nations: Sustainability or Scarcity?
Bangladesh (0.68), Pakistan (0.73), Myanmar (1.11), India (1.11), and Laos (1.12) anchor the low end of the footprint distribution — a cluster of South and Southeast Asian economies with low per-capita income, predominantly agrarian or light-industrial economic structures, and consumption patterns constrained by income rather than chosen environmental restraint. The critical analytical distinction in the footprint literature is between voluntary low-footprint living and involuntary low-footprint poverty. A Bangladeshi garment worker who eats a primarily plant-based diet, has minimal air travel, owns no car, and occupies a small dwelling has a low ecological footprint — but this is a consequence of income constraints, not a reflection of sophisticated environmental consciousness or deliberate sustainability choices.
The Sustainable Trade Index's ranking of these low-footprint countries highly reflects the index's methodology — which rewards low footprint scores regardless of whether they reflect choice or constraint. Bangladesh's #1 STI rank is a meaningful achievement in several dimensions (rule of law for trade, trade facilitation, social and governance indicators), but its low footprint is not meaningfully comparable to the footprint of a wealthy Scandinavian country that has maintained similarly modest consumption through deliberate policy. A more analytically useful comparison would adjust for income level, comparing footprint per unit of GDP rather than footprint per person — a measure on which several of the lowest-ranked STI countries (US, Canada, Australia) would improve significantly, and several of the highest-ranked would deteriorate.
End of Brief · Prism