Cost of Living Index 2026
Prism · Consumer Economics · Numbeo 2026
Cost of Living
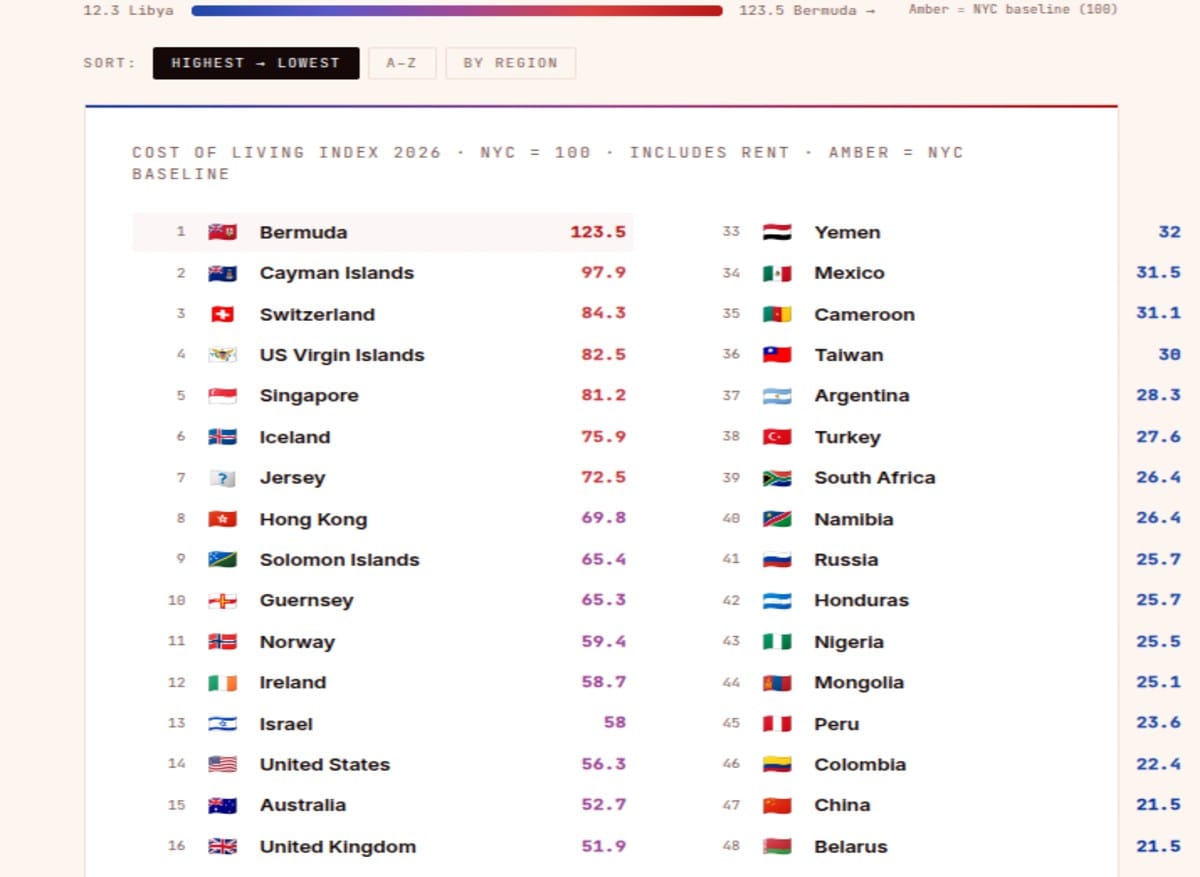
Index 2026 New York City = 100. Bermuda scores 123.5 — the world's most expensive country. Libya scores 12.3 — the world's cheapest. The global median is 30.9. The index measures everyday expenses including rent.
Index 2026 New York City = 100. Bermuda scores 123.5 — the world's most expensive country. Libya scores 12.3 — the world's cheapest. The global median is 30.9. The index measures everyday expenses including rent.
Methodology: Using NYC as a baseline of 100, the index measures relative prices of everyday expenses plus rent. A score of 120 means 20% more expensive than NYC; a score of 50 means half the cost.
123.5
Bermuda — Highest
30.9
Global Median
12.3
Libya — Lowest
12.3 Libya
123.5 Bermuda →
Amber = NYC baseline (100)
Sort:
Cost of Living Index 2026 · NYC = 100 · Includes Rent · Amber = NYC Baseline
Source: Numbeo 2026 · NYC = 100 baseline · Index includes everyday expenses + rent · Global median = 30.9
123.5
Bermuda
Most expensive country · 10× Libya
Most expensive country · 10× Libya
100
New York City
The baseline · Most countries are cheaper
The baseline · Most countries are cheaper
30.9
Global Median
Typical cost is 69% cheaper than NYC
Typical cost is 69% cheaper than NYC
12.3
Libya
Cheapest country · Subsidised energy + conflict economy
Cheapest country · Subsidised energy + conflict economy
What NYC as a Baseline Reveals
The Numbeo Cost of Living Index uses New York City as its baseline of 100 — a choice that immediately contextualises how expensive NYC actually is relative to the global median. A global median score of 30.9 means that the typical country on Earth charges less than one-third of what New York City does for the same basket of everyday goods and services including rent. Most of the world cannot afford to live like a New Yorker — not because their incomes are necessarily low relative to local costs, but because New York City's absolute cost level is extraordinary in global terms. The index is not primarily a ranking of global poverty — a country with a score of 30 may have entirely adequate living standards for its population's income; it simply means that specific goods and services cost 70% less than in NYC.
The index's inclusion of rent is its most important methodological choice — and the one most consequential for understanding where wealthy countries cluster. Rental markets in high-income cities like Singapore (81.2), Hong Kong (69.8), Switzerland (84.3), and the US (56.3) are inflated by the combination of limited housing supply, high-density demand, and speculative investment that characterises housing markets in the world's most economically productive locations. A country that scores 80 on this index is not 80% as expensive as NYC in all respects — it is 80% as expensive on the specific basket that Numbeo measures, which weights rent heavily. Countries with large rural populations and low urban housing costs will score substantially lower than their urban residents' actual experience would suggest.
The global median Cost of Living is 30.9 — less than a third of New York City's. This means that the majority of humanity lives in places where everyday life costs 70% less than in the city that the global economy's financial and cultural elite uses as a reference point for "expensive." The gulf between that reference point and global reality is one of the largest unmeasured inequalities in economic discourse.
Bermuda's Structural Isolation Premium
Bermuda's 123.5 — the highest in the dataset, 23.5% more expensive than NYC — is not the result of luxury consumption or particularly high local wages. It is the result of geographic isolation. Bermuda is an island 1,070 kilometres from the nearest major port. Almost everything consumed in Bermuda — food, building materials, consumer goods, vehicles, fuel — must be shipped there, and that shipping cost is embedded in the price of every product. The island's small size (53 square kilometres) also means that local production of almost anything is uneconomical. Bermuda's high cost of living is a pure transportation and isolation premium — the price of geographic remoteness passed entirely through to consumers.
The Cayman Islands (97.9) and the US Virgin Islands (82.5) exhibit the same pattern at slightly lower intensities — offshore financial centres and island territories where import dependence, limited competition among suppliers, and high local demand from affluent residents and tourists combine to push costs well above mainland equivalents. These jurisdictions are not expensive because their residents are particularly wealthy in local terms; they are expensive because the economics of supplying a small, remote population make everything cost more.
The European Variation: Switzerland to Ukraine
Europe presents the widest within-region cost variation of any continent in the dataset. Switzerland at 84.3 — the most expensive European country and among the most expensive globally — reflects the intersection of high wages (Swiss average wages are among the highest in the world), very strong currency (the Swiss franc has maintained extraordinary purchasing power for decades), and a domestic services sector that prices in those high wages. A haircut in Zurich, a restaurant meal in Geneva, or a plumber in Basel reflects a local labour market in which the alternative uses of that person's time are highly compensated. Switzerland's high cost is not primarily about imported goods being expensive — it is about locally produced services incorporating world-leading wages into their pricing.
Ukraine's 19.2 — at the other end of the European spectrum — captures a complex reality. Pre-2022 Ukraine was already a low-cost economy; the war has further depressed local prices in nominal terms as the hryvnia has weakened, domestic consumption has contracted, and parts of the services sector have collapsed. The 19.2 score reflects an economy where purchasing power has been severely compressed. Belarus (21.5) and Kosovo (19.5) represent post-Soviet and post-conflict economies whose low cost indices reflect structural economic weakness rather than efficient low-cost production — low prices driven by low wages, not by productive efficiency.
Africa's Range: Seychelles to Libya
Africa presents perhaps the most analytically interesting cost range in the dataset. The Seychelles at 48.0 — the highest in Africa — reflects the island nation's tourism economy: import dependence, high-income tourist demand, and the premium pricing that characterises luxury tourism destinations. Libya at 12.3 — the world's lowest — reflects a very different dynamic: an economy where energy subsidies dramatically reduce the cost of fuel, electricity, and transport, where conflict has depressed real estate and service prices, and where the formal economy has been partly replaced by informal arrangements that don't reflect NYC-comparable pricing. Libya's extraordinarily low score is not a development success story — it is the product of a conflict economy, state energy subsidies, and a damaged market structure that keeps measured prices low while simultaneously limiting the availability and quality of goods and services.
Egypt's 13.8 and Madagascar's 15.8 reflect similarly low but structurally different conditions. Egypt's low cost reflects currency weakness — the Egyptian pound has depreciated dramatically against the dollar in recent years, making Egypt appear inexpensive to dollar-earning index compilers while simultaneously making imported goods increasingly unaffordable for Egyptians whose incomes are denominated in local currency. A key methodological limitation of the index is that it measures dollar-equivalent costs, not affordability — a country with a score of 15 may be perfectly affordable for its residents on local wages, or it may be unaffordable despite the low dollar score if local wages have also collapsed.
End of Brief · Prism