CHINA'S $1.19 TRILLION
Prism · Trade & Geopolitics
General Administration of Customs, China · 2025
CHINA'S
$1.19
TRILLION
China's total trade surplus reached $1.19 trillion in 2025 — one of the largest on record. The United States accounts for $280 billion of that surplus. India $116 billion. Vietnam $100 billion. The surplus map is simultaneously a picture of Chinese export dominance and a blueprint for the tariff wars, trade negotiations, and industrial policy debates that will define the next decade of global economics.
Metric: China's bilateral trade surplus (exports minus imports) by partner · US$ billions · 2025 preliminary
Note: Hong Kong figures largely reflect re-exports and transshipment trade · not direct bilateral consumption
Top surplus partners: HK $303.9B · U.S. $280.4B · India $116.1B · Vietnam $100.2B · Netherlands $73.4B
Source: General Administration of Customs, China · December 2025 release
Note: Hong Kong figures largely reflect re-exports and transshipment trade · not direct bilateral consumption
Top surplus partners: HK $303.9B · U.S. $280.4B · India $116.1B · Vietnam $100.2B · Netherlands $73.4B
Source: General Administration of Customs, China · December 2025 release
Prism Desk·Source: General Administration of Customs, China·2025
China's Trade Surplus by Partner · US$ Billions · 2025
Hover bars for detail
Source: GACC
Source: GACC
$1.19TTotal global
surplus 2025
🇨🇳
China · Total Trade Surplus · 2025 · One of the Largest on Record
$1.19T
Total goods & services trade surplus · preliminary 2025
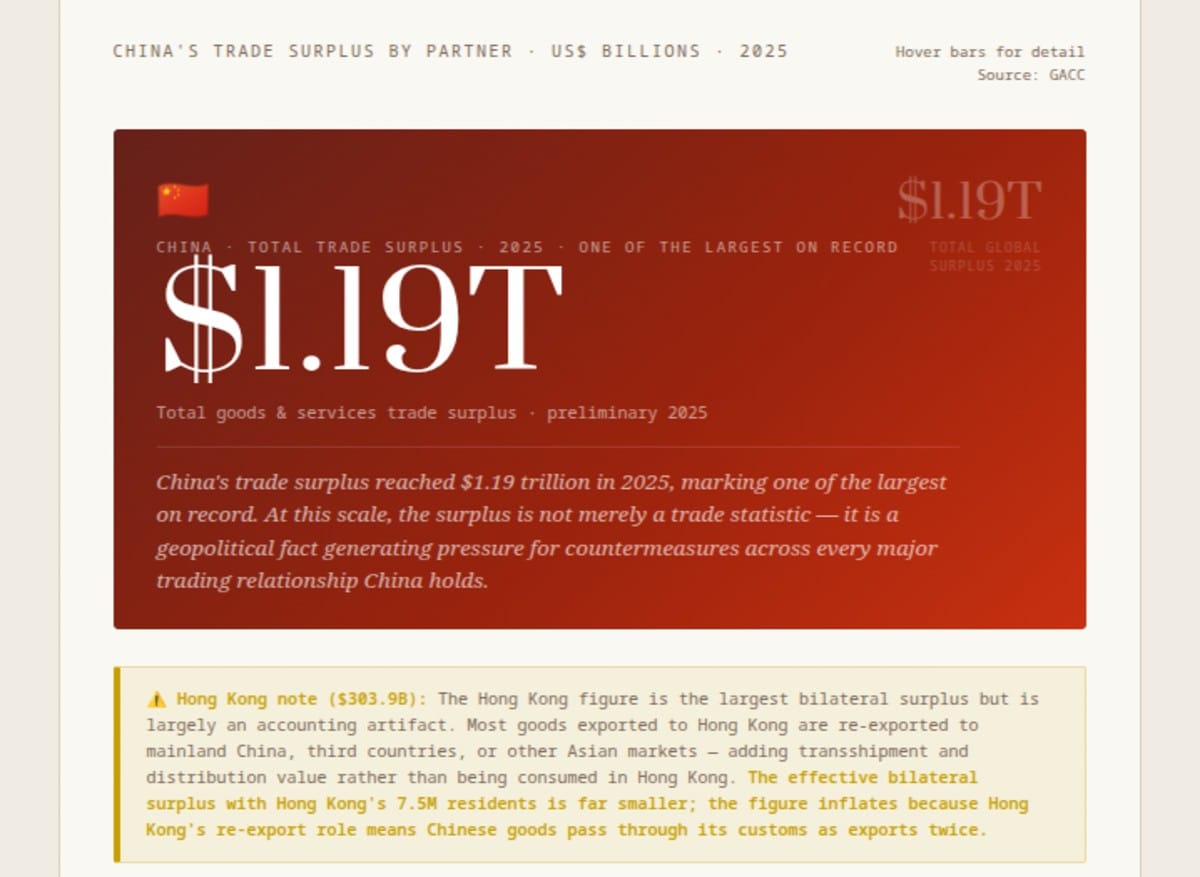
China's trade surplus reached $1.19 trillion in 2025, marking one of the largest on record. At this scale, the surplus is not merely a trade statistic — it is a geopolitical fact generating pressure for countermeasures across every major trading relationship China holds.
surplus 2025
⚠️ Hong Kong note ($303.9B): The Hong Kong figure is the largest bilateral surplus but is largely an accounting artifact. Most goods exported to Hong Kong are re-exported to mainland China, third countries, or other Asian markets — adding transshipment and distribution value rather than being consumed in Hong Kong. The effective bilateral surplus with Hong Kong's 7.5M residents is far smaller; the figure inflates because Hong Kong's re-export role means Chinese goods pass through its customs as exports twice.
$303.9BHong Kong
#1 surplus
re-export note
#1 surplus
re-export note
Effective #1: U.S.$280BExcluding HK re-export
U.S. is the real top bilateral
Primary tariff war driver
U.S. is the real top bilateral
Primary tariff war driver
Asian Neighbours$254BIndia $116B · Vietnam $100B
Thailand $54B · Singapore $46B
Philippines $39B
Thailand $54B · Singapore $46B
Philippines $39B
European Markets$203BNetherlands $73B · UK $66B
Italy $26B · Germany $25B
France $12B
Italy $26B · Germany $25B
France $12B
Tariff math: The U.S. bilateral surplus of $280B is the primary numerical basis for American tariff demands against China. The Trump administration's 2025 tariff escalation explicitly cited the bilateral imbalance as the justification for import duties of 25–145% on Chinese goods. Whether bilateral trade surpluses are an appropriate policy target is contested by economists — bilateral imbalances reflect comparative advantage and are not inherently unfair — but the political salience of the number is undeniable, and the $280B figure will remain the central data point in U.S.-China trade negotiations for years.
Source: General Administration of Customs, China · December 2025 release · Preliminary data · Values in US$ bn
$1.19TChina Total
Trade Surplus
Trade Surplus
$303.9BHK (#1)
Re-export Note
Re-export Note
$280.4BU.S. (#2)
Primary Target
Primary Target
$116.1BIndia (#3)
Rising Tension
Rising Tension
A Trillion-Dollar Imbalance
China's $1.19 trillion trade surplus in 2025 is one of the largest annual trade surpluses ever recorded by any country in history, in both absolute and relative terms. To contextualise the number: it is larger than the entire GDP of most countries in the world; it represents approximately $820 per Chinese citizen per year flowing into the country through net exports; and it is roughly three times the trade surplus that Germany — the next largest sustained surplus economy — ran in the same year. The number is a product of China's extraordinary manufacturing export machine meeting a global demand for Chinese-made goods that no combination of tariffs, political pressure, or supply chain diversification has yet substantially reduced.
The bilateral surplus data — breaking the $1.19 trillion total into specific partner relationships — reveals both the expected and the surprising. The United States at $280.4 billion is the expected bilateral surplus driver: a large, high-consumption economy whose manufacturing base has hollowed out over four decades and whose consumer appetite for electronics, machinery, furniture, and consumer goods has remained strong through successive rounds of tariff escalation. But the presence of India at $116 billion, Vietnam at $100 billion, and Southeast Asian neighbours in the $38-73 billion range reflects a dimension of Chinese export dominance that the U.S.-centric trade war narrative often obscures. China's surplus is not primarily an American problem — it is a global surplus that happens to have the United States as its largest single bilateral partner.
$1.19 trillion. A surplus larger than the GDP of most countries. Roughly $820 per Chinese citizen per year in net export value. Germany is the next largest sustained surplus economy — at roughly one-third the scale.
The United States at $280 Billion: The Tariff War's Arithmetic
The U.S.-China bilateral trade imbalance of $280.4 billion is the single most politically consequential trade statistic in the world. It is the number that American politicians of both parties cite when calling for tariffs and trade restrictions; it is the number that Chinese officials refer to when arguing that bilateral imbalance reflects structural comparative advantage rather than unfair practices; and it is the number that drives the specific tariff escalation logic of the Trump administration's 2025 trade policy, which used the bilateral deficit as the mathematical basis for "reciprocal tariff" rates that were among the highest the United States had imposed on any trading partner in the post-war era.
The persistence of the surplus through multiple rounds of tariff escalation — the 2018-2019 first round, the 2022-2024 extensions, the 2025 escalation to 25-145% on many categories — reflects several structural realities that tariffs have difficulty addressing. American consumers continue to buy Chinese-made goods even at tariff-inflated prices because the combination of Chinese manufacturing efficiency, scale, and vertical integration in key product categories makes it difficult for alternative suppliers to match on price and availability simultaneously. Supply chain diversification toward Vietnam, Mexico, and India has occurred, but Chinese suppliers retain significant roles in the supply chains of those alternative manufacturers — Chinese intermediate goods flow into Vietnamese and Mexican assembly facilities before reaching American consumers.
The bilateral arithmetic also reflects the specific structure of American demand: electronics, machinery, furniture, textiles, and consumer goods are the largest import categories from China, and these categories have proven resistant to reshoring because the American manufacturing ecosystem that would produce them at competitive cost no longer fully exists after four decades of offshoring. A tariff can raise the price of Chinese goods; it cannot instantly reconstitute the supply chains, workforce skills, and manufacturing infrastructure that would be required to produce equivalent goods in the United States.
India at $116 Billion: The Tensions No One Is Covering
India's $116 billion bilateral deficit with China is the third largest in the world and one of the most geopolitically charged — yet it receives a fraction of the media attention devoted to the U.S.-China trade relationship. India has been attempting to reduce its dependence on Chinese imports through the Production-Linked Incentive (PLI) schemes that provide subsidies for domestic manufacturing in electronics, pharmaceuticals, textiles, and other sectors, through customs duties specifically targeting Chinese goods in sensitive categories, and through the explicit policy goal of making India a manufacturing alternative to China for global supply chains.
The $116 billion figure tells the story of how far India has to go. Despite the border tensions following the 2020 Galwan Valley clash, despite the banning of hundreds of Chinese apps (including TikTok), despite the rhetorical commitment to "Atmanirbhar Bharat" (self-reliant India), China remains by far India's largest source of imports in electronics components, active pharmaceutical ingredients, and machinery. The bilateral deficit actually grew in 2024-2025 as India's manufacturing ambitions have not yet produced the domestic supply capacity to replace Chinese imports at the scale required. India is in the paradoxical position of competing strategically with China while remaining commercially dependent on it — a contradiction that its economic development trajectory will have to resolve.
Vietnam at $100 Billion: The Manufacturing Corridor's Hidden Cost
Vietnam's $100 billion bilateral deficit with China is perhaps the most counterintuitive figure in the dataset. Vietnam has been among the biggest beneficiaries of the U.S.-China trade war — American companies seeking to reduce their China exposure have invested heavily in Vietnamese manufacturing capacity for electronics, textiles, footwear, and furniture. Vietnam's exports to the United States have grown dramatically as a result. But Vietnamese manufacturing relies heavily on Chinese intermediate goods, components, and machinery — and this dependency shows up directly in the bilateral deficit figures.
The Vietnam case illustrates the "China plus one" strategy's structural limitation: moving final assembly to Vietnam reduces the bilateral surplus the United States runs with China by substituting "made in Vietnam" for "made in China" on the export label. But the Chinese inputs that flow into Vietnamese manufacturing create a bilateral surplus between China and Vietnam that partially offsets the reduction in the China-U.S. bilateral gap. From the perspective of Chinese total export earnings, the shift of final assembly to Vietnam reduces the bilateral surplus with the United States while simultaneously increasing the bilateral surplus with Vietnam — the net effect on China's overall trade position is significantly less than the U.S.-China bilateral numbers might suggest.
The Netherlands at $73 Billion: Europe's Import Gateway
The Netherlands' $73.4 billion bilateral deficit with China — making it the fifth largest surplus partner, ahead of the UK, Germany, and France — reflects Rotterdam's role as the entry port for Chinese goods entering the European Union. Rotterdam is Europe's largest port and the primary customs entry point for containerised goods from Asia. When a container ship carrying Chinese electronics, machinery, or consumer goods arrives at Rotterdam and clears Dutch customs, it registers as a Dutch import from China regardless of whether the goods are ultimately consumed in the Netherlands, Germany, France, Spain, or elsewhere in the EU single market.
The Dutch bilateral deficit therefore significantly overstates the Netherlands' own consumption of Chinese goods and reflects the statistical artifact of Rotterdam's import clearance role within the EU trade accounting system. Germany's $25.4 billion bilateral deficit, by contrast, represents German consumption of Chinese goods with the Rotterdam clearance effect partially removed. The true picture of EU-China trade requires looking at the aggregate European position rather than individual bilateral figures for member states — the EU collectively runs a substantial deficit with China, but the bilateral distribution across member states is heavily influenced by port-of-entry geography rather than actual consumption patterns.
The Netherlands at $73B vs. Germany at $25B in China bilateral surplus. Rotterdam is Europe's import gateway — Chinese goods clear Dutch customs before reaching Germany, France, and Spain. The bilateral figure reflects port geography, not Dutch consumption. Trade statistics require reading carefully.
What $1.19 Trillion Means for Global Trade Architecture
The scale of China's 2025 trade surplus — $1.19 trillion — has moved the surplus from a trade policy issue into a macroeconomic stability question. A surplus of this magnitude means that China is absorbing demand from the rest of the world at a scale that, if it persists, requires either sustained capital outflows from China (recycling the surplus by investing abroad) or significant adjustment pressure on surplus countries' trading partners through currency appreciation, import restriction, or both.
The historical precedent most often cited is Japan's large trade surpluses of the 1980s, which generated enormous diplomatic pressure culminating in the Plaza Accord of 1985, where Japan, Germany, France, the UK, and the United States collectively agreed to appreciate the yen and Deutsche Mark against the dollar. China's current situation is more complex: China is not party to any equivalent multilateral coordination mechanism, the dollar-yuan exchange rate is managed by Chinese authorities rather than set by market forces, and China's surplus is significantly larger relative to global GDP than Japan's ever was. The trade war approach of unilateral tariff escalation is, in historical terms, the least efficient response to a large bilateral surplus — but it is the instrument that American political economy has reached for, and the $280 billion U.S.-China figure will continue to be its primary numerical justification. At $1.19 trillion total, China's surplus is not a problem any single country's trade policy can solve — it is a global macroeconomic imbalance that requires coordinated response at a scale that the current architecture of international economic governance cannot easily produce.
End of Brief · Prism