AMERICA'S GROWING MOUNTAIN OF DEBT
Prism · Personal Finance
NY Fed / BEA · 2025 Q3
GROWING
MOUNTAIN
OF DEBT Auto loans: $1.66 trillion. Student loans: $1.65 trillion. Credit cards: $1.23 trillion. The average American household paid $4,214 in non-mortgage interest in Q1 2025. Twenty years of consumer debt data reveal a structural shift in how Americans fund their lives.
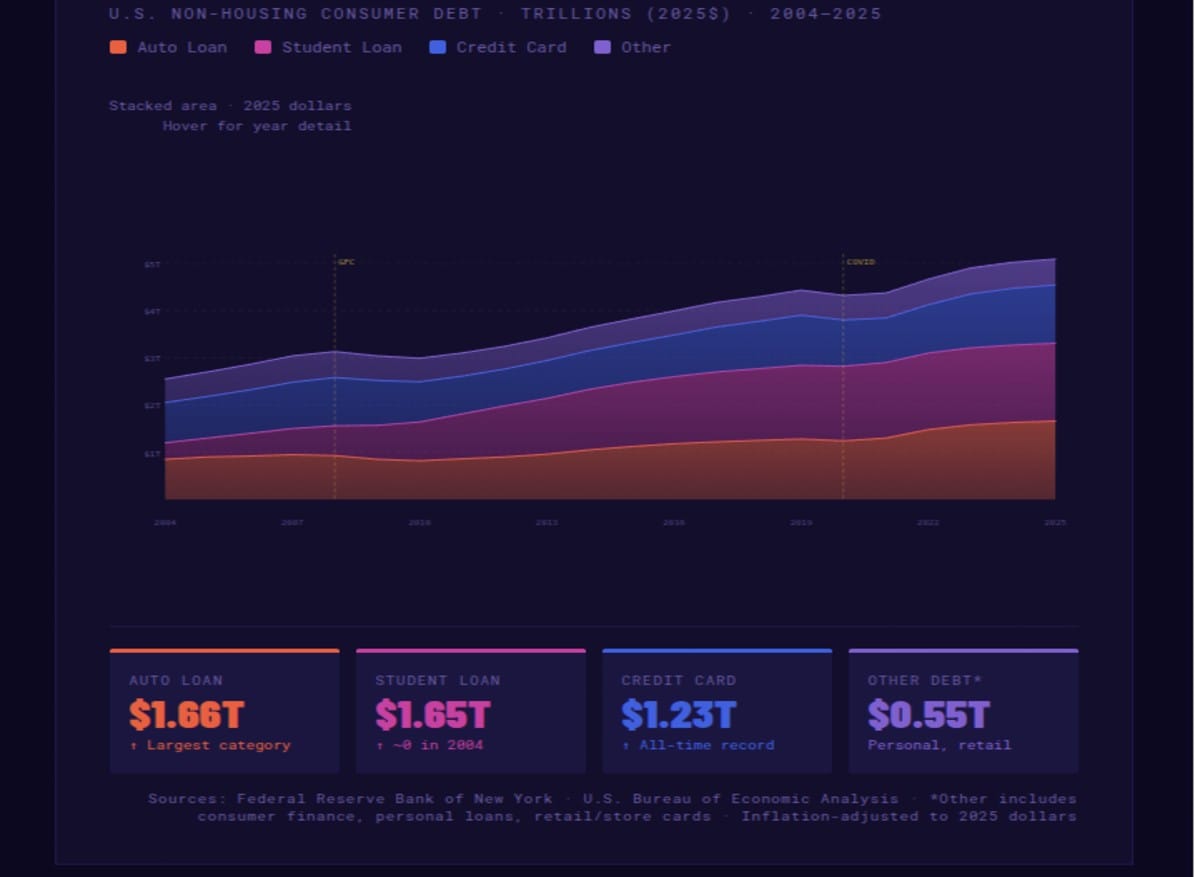
Metric: Inflation-adjusted U.S. non-housing consumer debt by type · Trillions of 2025 dollars
*Other debt includes consumer finance, personal loans, retail and store cards, miscellaneous loans
Sources: Federal Reserve Bank of New York · U.S. Bureau of Economic Analysis
*Other debt includes consumer finance, personal loans, retail and store cards, miscellaneous loans
Sources: Federal Reserve Bank of New York · U.S. Bureau of Economic Analysis
💸 Interest burden: In Q1 2025, the average U.S. household paid approximately $4,214 per year in non-mortgage interest — roughly $351/month dedicated entirely to the cost of borrowing, before paying down any principal.
U.S. Non-Housing Consumer Debt · Trillions (2025$) · 2004–2025
Auto Loan
Student Loan
Credit Card
Other
Stacked area · 2025 dollars
Hover for year detail
Hover for year detail
Auto Loan
$1.66T
↑ Largest category
Student Loan
$1.65T
↑ ~0 in 2004
Credit Card
$1.23T
↑ All-time record
Other Debt*
$0.55T
Personal, retail
Sources: Federal Reserve Bank of New York · U.S. Bureau of Economic Analysis · *Other includes consumer finance, personal loans, retail/store cards · Inflation-adjusted to 2025 dollars
$5.09TTotal Non-Housing
Consumer Debt 2025
Consumer Debt 2025
$1.65TStudent Loans
Near-Zero in 2004
Near-Zero in 2004
$1.23TCredit Card Debt
All-Time Record
All-Time Record
$4,214Annual Non-Mortgage
Interest Per Household
Interest Per Household
A Mountain Built Over Twenty Years
America's non-housing consumer debt — auto loans, student loans, credit cards, and personal loans — has grown from approximately $2.5 trillion in 2004 to over $5 trillion in 2025, measured in inflation-adjusted 2025 dollars. This doubling of real consumer debt over two decades is not primarily a story about irresponsible individual borrowing. It is a story about structural changes in the American economy that have made debt a near-mandatory feature of middle-class life: the rising cost of automobiles (now averaging $48,000 for new and $26,000 for used), the explosion of higher education costs that made student loans unavoidable for most four-year degree seekers, and the stagnation of real wages relative to the cost of housing, healthcare, and education that has pushed credit card usage from discretionary tool to essential cash-flow management instrument.
The debt mountain's shape has changed dramatically since 2004. Twenty years ago, auto loans and credit cards dominated consumer debt, with student loans a relatively small fraction. By 2025, student loans at $1.65 trillion and auto loans at $1.66 trillion are nearly equal in size, and each is more than a trillion dollars larger than at the start of the data series. The student loan category's growth from near-negligible to the second-largest consumer debt category is the single most consequential structural change in the American household balance sheet of the past twenty years.
The average American household pays $4,214 per year in non-mortgage interest — $351 per month — before paying down a dollar of principal. That is money that cannot be saved, invested, or spent on other things. It is the cost of debt itself.
Auto Loans at $1.66T: When Transportation Became a Financial Product
Auto loan debt at $1.66 trillion is now the largest single category of U.S. non-housing consumer debt. This reflects two converging trends: rising vehicle prices and longer loan terms. The average new vehicle price has risen sharply in the past decade, particularly during the COVID-era supply chain shortage of 2021-2023, when new car prices reached historic highs as chip shortages and supply disruptions created genuine scarcity. Simultaneously, the average auto loan term has stretched from 48 months historically to 72 months — and increasingly 84 months — as lenders and consumers attempt to make rising vehicle prices fit into existing monthly payment budgets.
The combination of higher prices and longer terms has produced a debt structure with concerning properties. Longer-term auto loans mean consumers are frequently "underwater" — owing more on a vehicle than it is worth — for extended periods, limiting their ability to trade in vehicles without rolling existing negative equity into new loans. The subprime auto loan market, which expanded significantly in the 2010s and has faced rising delinquency rates since 2022, represents the most financially stressed portion of the auto debt mountain — borrowers who took on high-rate, long-term loans for vehicles that are rapidly depreciating assets.
Student Loans at $1.65T: The Education Debt Crisis
The growth of student loan debt from a minor category in 2004 to $1.65 trillion by 2025 is one of the defining economic stories of the Millennial and early Gen-Z generations. The mechanism is straightforward: college tuition has risen far faster than inflation for four consecutive decades, financial aid has not kept pace, and the federal student loan program — which does not underwrite based on a borrower's ability to repay or the economic value of their degree — has enabled this price inflation by providing unlimited credit to students regardless of the employment prospects of their chosen field.
The consequences are concentrated but severe. Approximately 43 million Americans hold federal student loan debt, with an average balance around $38,000. Among borrowers who attended graduate or professional school, average balances are substantially higher. The political salience of student debt has generated repeated policy interventions — income-driven repayment modifications, targeted forgiveness programs under the Biden administration, and legal challenges to broader forgiveness — without resolving the underlying structural problem: a higher education system whose prices have been systematically insulated from competitive pressure by the availability of federal loan financing. The student debt mountain is both a symptom of failed higher education policy and a constraint on the economic behaviour of tens of millions of working-age Americans who are paying down education costs years or decades into their careers.
Credit Cards at $1.23T: The Cash Flow Emergency
Credit card debt reached an all-time record in 2025, driven by a combination of factors that the Federal Reserve's rapid rate-hiking cycle from 2022-2023 has made considerably more expensive. The average credit card APR exceeded 20% for the first time in 2023 and has remained elevated — meaning that Americans carrying balances are paying extraordinary rates on what has become, for many households, a cash flow management tool rather than a discretionary spending instrument.
The transition of credit cards from discretionary to essential is visible in data on credit card usage patterns. Research from the Consumer Financial Protection Bureau and academic economists shows a growing share of credit card debt being carried by households that have no other liquid assets — people who are using revolving credit not to fund vacations or electronics but to bridge gaps between paycheques and recurring expenses like utilities, groceries, and insurance. When auto loan payments and student loan payments are absorbing significant shares of take-home pay, credit cards become the marginal liquidity source for essential expenses. At 20%+ APR, this creates a debt trap that is mathematically very difficult to escape without a significant income increase or a debt discharge event.
The $4,214 Interest Drain
The headline statistic that ties the debt mountain to household lived experience is the interest payment figure: $4,214 per year in non-mortgage interest for the average U.S. household in Q1 2025. This is money that does not reduce debt principal, does not build assets, does not fund consumption — it is pure transfer to lenders for the cost of access to credit that is itself often a necessity rather than a choice. Distributed monthly, it is $351 that every month leaves a typical American household and enriches the financial system without producing anything for that household.
The distributional implications of this interest drain are significant. High-credit-score households carry lower APRs and tend to carry less revolving debt. Low-credit-score households — disproportionately lower-income, younger, and from minority communities — carry higher APRs and more revolving debt. The interest drain as a share of income is substantially higher for lower-income households than for wealthier ones, making the consumer debt system one of the most regressive elements of the American financial structure. A household earning $40,000 and paying $4,214 in interest is spending 10.5% of gross income on debt service; a household earning $150,000 paying the same amount is spending 2.8%.
The India Comparison: Different Debt, Same Dynamics
India's consumer credit market is far smaller in absolute terms but is growing rapidly and faces some structurally similar dynamics. Reserve Bank of India data shows significant growth in personal loans, credit card debt, and two-wheeler/vehicle loans over the past decade. India's fintech ecosystem — dominated by apps like Paytm, PhonePe, and BNPL platforms — has dramatically expanded access to consumer credit in a way that echoes the American credit card expansion of the 1990s-2000s, with similar concerns about borrowers using easy credit to bridge income gaps rather than fund genuine discretionary spending.
India's higher education financing market, while significantly smaller than America's, is evolving in ways that raise familiar concerns. The expansion of private engineering colleges, management institutes, and professional schools at tuition levels far above what government grants cover has created a student loan market that the Indian government's Pradhan Mantri Vidyalakshmi programme is attempting to address systematically. The risk of replicating America's student debt crisis is real — a higher education system whose costs outpace income growth, financed by loans whose terms are poorly matched to graduate employment prospects, is a policy failure that is not uniquely American. India's opportunity is to learn from the American trajectory and design education financing that does not create a debt mountain before it has fully formed.
End of Brief · Prism