AMERICA ON THE MOVE 2020–2025
Prism · Demographics
U.S. Census Bureau · April 2020 – July 2025
AMERICA
ON THE MOVE
2020–2025
Idaho grew 10.4% — the fastest of any state. The South gained 7.6 million residents, more than all other regions combined. West Virginia lost −1.5% — tied with Hawaii for the steepest decline. The national average was 3.1%. The post-pandemic American migration map is a record of cost, climate, remote work, and the long-running structural shift toward Sun Belt living.
Metric: Population % change · April 2020 Census → July 2025 estimate
Leaders: Idaho +10.4% · Montana +5.6% · South Carolina +8.8% · Texas +8.8% · Florida +8.9%
Decliners: West Virginia −1.5% · Hawaii −1.5% · Louisiana −0.9% · New York −1.0%
Source: U.S. Census Bureau · Data from April 2020 to July 2025
Leaders: Idaho +10.4% · Montana +5.6% · South Carolina +8.8% · Texas +8.8% · Florida +8.9%
Decliners: West Virginia −1.5% · Hawaii −1.5% · Louisiana −0.9% · New York −1.0%
Source: U.S. Census Bureau · Data from April 2020 to July 2025
Prism Desk·Source: U.S. Census Bureau·2020–2025
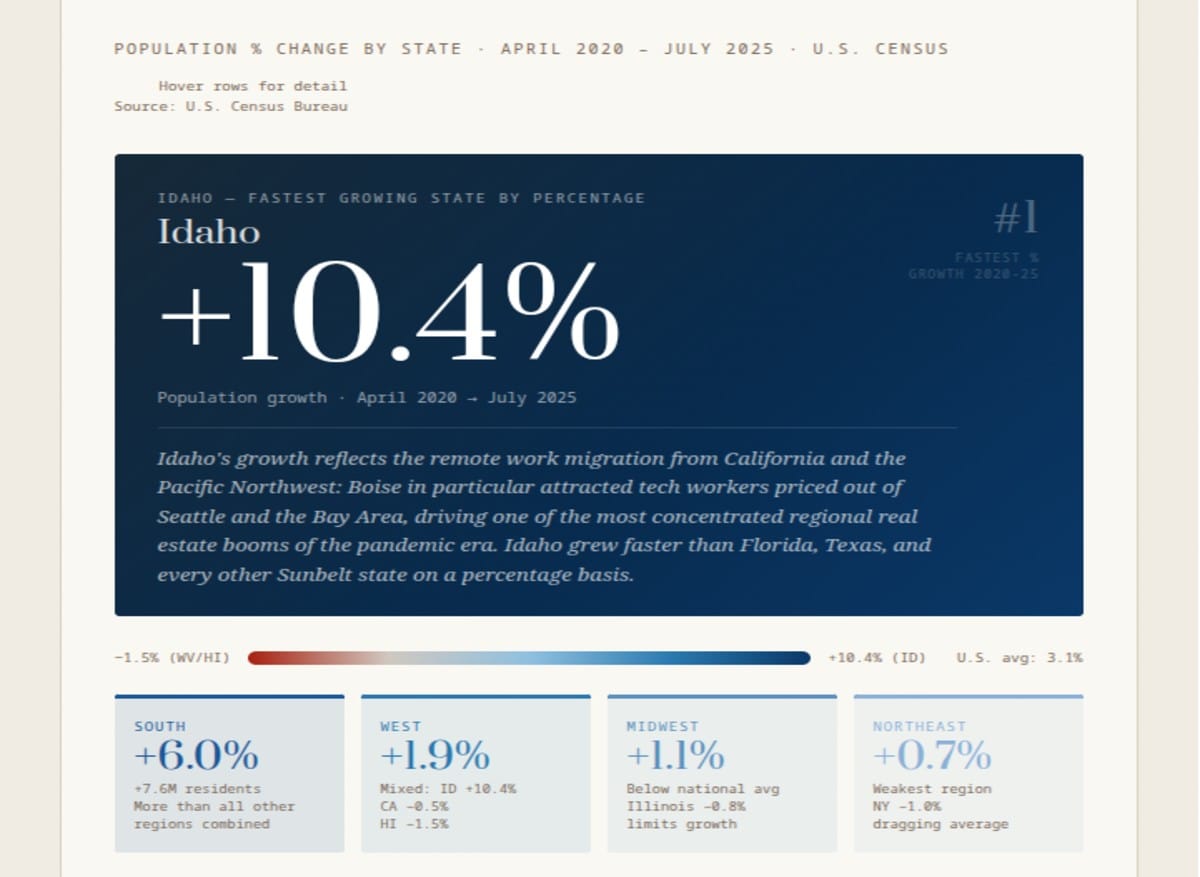
Population % Change by State · April 2020 – July 2025 · U.S. Census
Hover rows for detail
Source: U.S. Census Bureau
Source: U.S. Census Bureau
#1Fastest %
growth 2020-25
Idaho — Fastest growing state by percentage
Idaho
+10.4%
Population growth · April 2020 → July 2025
Idaho's growth reflects the remote work migration from California and the Pacific Northwest: Boise in particular attracted tech workers priced out of Seattle and the Bay Area, driving one of the most concentrated regional real estate booms of the pandemic era. Idaho grew faster than Florida, Texas, and every other Sunbelt state on a percentage basis.
growth 2020-25
−1.5% (WV/HI)
+10.4% (ID)
U.S. avg: 3.1%
South
+6.0%
+7.6M residents
More than all other
regions combined
More than all other
regions combined
West
+1.9%
Mixed: ID +10.4%
CA −0.5%
HI −1.5%
CA −0.5%
HI −1.5%
Midwest
+1.1%
Below national avg
Illinois −0.8%
limits growth
Illinois −0.8%
limits growth
Northeast
+0.7%
Weakest region
NY −1.0%
dragging average
NY −1.0%
dragging average
Since 2020, the South gained 7.6 million residents — more than all other regions combined. The South's +6.0% regional growth rate is more than 3× the Northeast's +0.7% and nearly triple the Midwest's +1.1%. Florida (+8.9%), Texas (+8.8%), South Carolina (+8.8%), Tennessee (+5.8%), and North Carolina (+7.2%) all grew at rates 2–3× the national average.
Mountain West LeadersID · MT · UTIdaho +10.4% · Montana +5.6%
Utah +8.2% · Nevada +5.7%
Remote work + affordability
Utah +8.2% · Nevada +5.7%
Remote work + affordability
Sunbelt Surge7 of top 10FL +8.9% · TX +8.8%
SC +8.8% · NC +7.2%
GA +5.5% · TN +5.8%
SC +8.8% · NC +7.2%
GA +5.5% · TN +5.8%
Decliners6 statesWV −1.5% · HI −1.5%
LA −0.9% · NY −1.0%
CA −0.5% · IL −0.8%
LA −0.9% · NY −1.0%
CA −0.5% · IL −0.8%
The South at +6.0% in five years is building cumulative political consequences: Congressional apportionment follows the decennial census, meaning the 2030 census will almost certainly shift additional House seats from the Northeast and Midwest to the South and Mountain West. The political geography of America is being redrawn in real-time by housing costs, remote work access, and the climate and lifestyle preferences of a generation that can work from anywhere.
Source: U.S. Census Bureau · April 2020 Census → July 2025 estimates · State estimates
+10.4%Idaho
Fastest Growth
Fastest Growth
−1.5%WV & Hawaii
Steepest Decline
Steepest Decline
+6.0%South Region
+7.6M residents
+7.6M residents
+0.7%Northeast Region
Slowest Growth
Slowest Growth
Idaho at +10.4%: The Remote Work Geography
Idaho's status as the fastest-growing state in America by percentage from 2020 to 2025 is one of the clearest expressions of the remote work migration pattern that the COVID-19 pandemic accelerated. The state grew 10.4% in five years — faster than Florida, Texas, or South Carolina, despite none of the established Sunbelt amenities those states are typically associated with. The growth concentrated primarily in the Treasure Valley area around Boise, which experienced a housing market transformation in 2020-2022 that was among the most dramatic of any metropolitan area in the country.
Boise's attraction to remote workers from the Pacific coast was driven by a specific combination: significant cost differential from San Francisco and Seattle (where median home prices were $1.2-1.5M versus Boise's $350-400K before the migration surge), physical proximity to both mountains and outdoor recreation, reasonable flight connectivity to major West Coast cities for the occasional in-person requirement, and a cultural and political environment that appealed to the specific demographic of remote workers leaving California. The migration inflated Boise home prices by approximately 60-70% between 2020 and 2022 before the Federal Reserve's rate increases cooled the market, creating a local affordability crisis that somewhat mirrored the one that had driven migration from California in the first place. Idaho's growth story is the migration cycle made visible: affordability advantage attracts migration, migration erodes affordability advantage, the frontier shifts to the next affordable market.
Idaho grew faster than Florida, Texas, and South Carolina. Remote work from Seattle and the Bay Area found its cost-of-living frontier in Boise. The result was a 10.4% population gain in five years — and a housing market that replicated, in miniature, exactly the affordability crisis that drove the migration.
The South at +6.0%: Seven Million Movers
The South's 7.6 million net population gain from 2020 to 2025 — more than all other regions combined — represents the continuation and acceleration of a demographic shift that has been under way for decades but reached a new intensity in the post-pandemic period. The driving states were Florida (+8.9%), Texas (+8.8%), South Carolina (+8.8%), North Carolina (+7.2%), Tennessee (+5.8%), Georgia (+5.5%), and Arkansas (+3.4%) — a broad-based regional surge that was not the product of any single attractor but of a consistent set of pull factors operating across the region.
The pull factors are well-documented: lower state income taxes (Texas and Florida have none), lower housing costs than comparable major markets in the Northeast and California, warm climates that appeal to both retirees and younger workers who now have locational flexibility, and state policy environments that some residents prefer on regulatory and fiscal grounds. The push factors from source states are equally well-documented: high housing costs, state and local income tax burdens, and pandemic-era restrictions that accelerated pre-existing migration intentions for people who had been considering a move but needed a catalysing event to act.
Florida and Texas: Scale and Rate Together
Florida's +8.9% and Texas's +8.8% represent a rare combination: states that are both large (Florida 22+ million, Texas 30+ million) and growing at rapid percentage rates. Large states typically have lower percentage growth rates because the denominator is large; small states can grow quickly in percentage terms while adding modest absolute numbers. That Florida and Texas are growing both in percentage and absolute terms simultaneously reflects the exceptional pull strength of both states' migration attractiveness.
Florida's growth is demographically distinct from Texas's. Florida's in-migration includes a disproportionate share of retirees and near-retirees who have reached the point in their lives where locational flexibility is high and climate preference becomes a primary factor — the Baby Boom generation's retirement wave is driving Florida's numbers in ways that are not driven by employment availability. Texas's growth is more economically diverse: Austin's technology sector, Dallas-Fort Worth's corporate relocation boom, Houston's energy and medical sectors, and San Antonio's military and logistics economy have all attracted working-age migrants from both the Northeast and the West Coast.
The Decliners: Structural Divergence
West Virginia's −1.5% loss and New York's −1.0% decline represent different types of demographic shrinkage that require different analytical frameworks. West Virginia's decline is structural and long-running: the state's economy has been contracting relative to national growth for decades, driven by the decline of coal mining employment, limited economic diversification, and an age structure that reflects decades of out-migration by working-age residents leaving few behind to form families. West Virginia now has one of the oldest median ages of any state, one of the lowest labour force participation rates, and one of the most severe opioid epidemic death tolls in the country — all of which reduce net population through a combination of out-migration and excess mortality.
New York's −1.0% is a different phenomenon: a large, wealthy, diverse state losing population primarily through the departure of middle-income residents for lower-cost states, while also experiencing net international immigration that partially offsets the domestic out-migration. New York City in particular has seen significant net domestic out-migration offset only partially by international immigration. The primary destinations for departing New Yorkers have been Florida, Texas, North Carolina, and other Sun Belt states — a financially motivated migration of residents who retain economic connections to New York (many continue working for New York firms remotely) while converting to lower-tax, lower-cost residential environments.
California's −0.5% is the politically most discussed of the decliners and perhaps the most misunderstood. California continues to attract international immigration at significant rates, continues to be the preferred destination for the highest-skill technology and entertainment industry workers, and continues to have by far the largest absolute economy of any state. The −0.5% decline reflects a specific demographic: domestic out-migration by cost-burdened middle-income residents who cannot afford California's housing market. California is not in generalised decline — it is in demographic bifurcation: growing at the high end (wealthy, high-skill workers who can afford housing or whose employers provide it) and contracting at the middle and lower end (workers priced out of homeownership and proximate to affordable-housing alternatives in other states).
Hawaii at −1.5%: The Isolated Economy's Limits
Hawaii's −1.5% — tied with West Virginia for the steepest state-level percentage decline — is the most surprising figure in the dataset and the one with the most distinct causal story. Hawaii is not an economically distressed state by conventional metrics: median household income is above the national average, unemployment has been low, and the tourism sector that dominates the economy has recovered from pandemic disruption. But Hawaii has among the highest cost of living of any state, particularly for housing and food (both heavily import-dependent given the island geography), and its geographic isolation makes it expensive to live on a local income rather than a remote income from a mainland employer.
Hawaii's population decline reflects the departure of long-term Hawaii residents — particularly Native Hawaiians and Pacific Islander communities — who face housing costs that have become unaffordable on local wages and who have relocated to the Pacific Northwest, Nevada, and other states where Hawaii's cultural diaspora communities are established. This is Hawaii's specific version of the gentrification and displacement dynamic that affects many high-cost urban areas: an economy that is attractive to high-income visitors and remote workers from wealthier markets simultaneously prices out the communities that constitute the state's own cultural identity. At −1.5%, Hawaii is technically tied with West Virginia at the bottom of the state growth ranking — an extraordinary juxtaposition of the most economically distressed Appalachian state and one of the world's most desirable island destinations, united by the same metric of population loss from very different underlying causes.
End of Brief · Prism