AIR QUALITY BY STATE: WHO PASSES?
Prism · Public Health & Environment
America's Health Rankings / USEPA · 2022–2024
BY STATE:
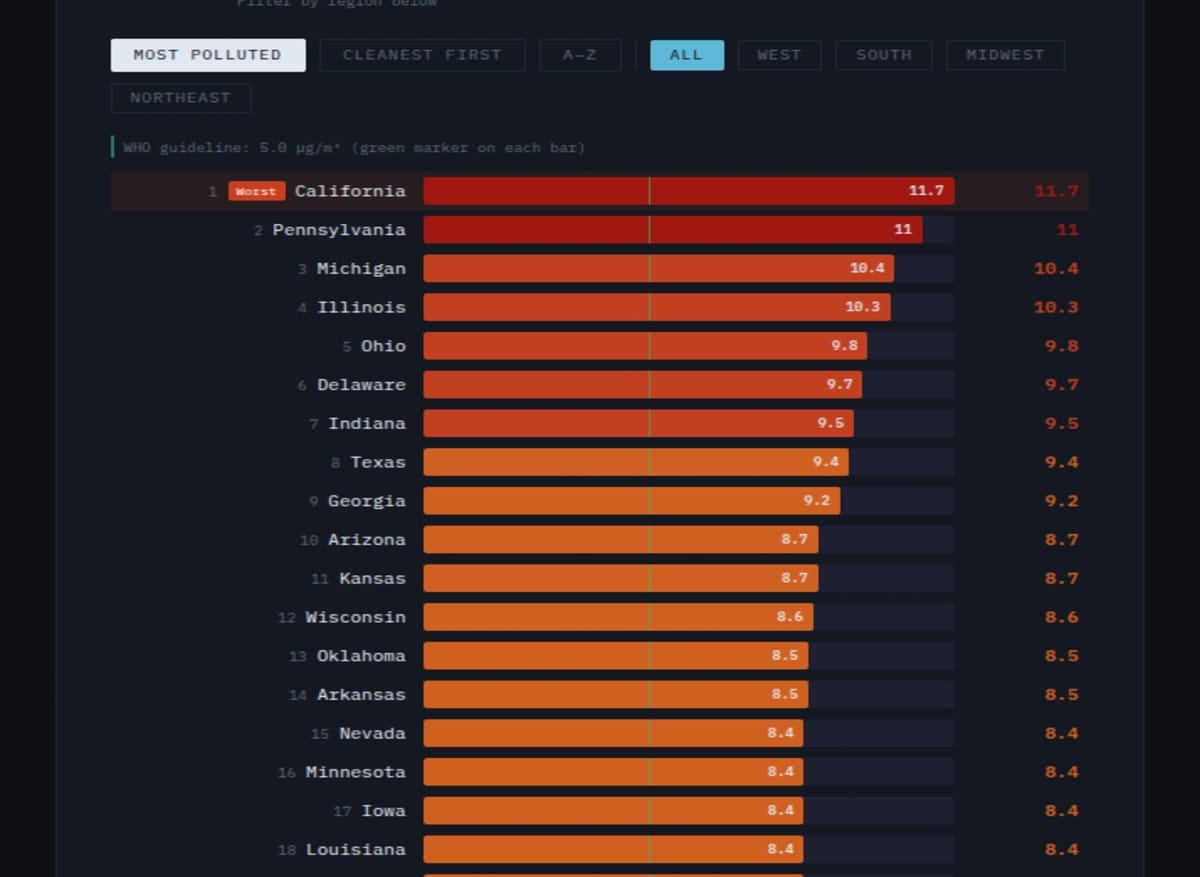
WHO PASSES? The WHO sets a PM2.5 air quality guideline of 5 μg/m³. Every single U.S. state exceeds it. Wyoming comes closest at 4.1 — actually below the guideline. California, at 11.7, breathes air more than twice as polluted as WHO considers safe.
Metric: Annual average PM2.5 concentration · μg/m³ (micrograms per cubic metre) · 2022–2024 average
PM2.5 = fine particulate matter ≤2.5 micrometres · Penetrates deep into lungs and bloodstream
Sources: America's Health Rankings 2025 Report · USEPA
PM2.5 = fine particulate matter ≤2.5 micrometres · Penetrates deep into lungs and bloodstream
Sources: America's Health Rankings 2025 Report · USEPA
🌿 WHO Air Quality Guideline: 5 μg/m³ annual mean PM2.5
Exceeding this level is associated with increased mortality from cardiovascular and respiratory disease.
Only Wyoming (4.1) meets this standard. All other states exceed it. The national average is approximately 8–9 μg/m³.
Exceeding this level is associated with increased mortality from cardiovascular and respiratory disease.
Only Wyoming (4.1) meets this standard. All other states exceed it. The national average is approximately 8–9 μg/m³.
Annual Average PM2.5 · μg/m³ · By State · 2022–2024
4.1
11.7 (CA)
4681011.7
Green line = WHO guideline (5 μg/m³)
Filter by region below
Filter by region below
WHO guideline: 5.0 μg/m³ (green marker on each bar)
Sources: America's Health Rankings 2025 Report · USEPA · Annual average PM2.5 concentration · 2022–2024 data
11.7California
Most Polluted
Most Polluted
4.1Wyoming
Only WHO-Safe
Only WHO-Safe
5.0WHO PM2.5
Guideline μg/m³
Guideline μg/m³
50/51States Exceeding
WHO Guideline
WHO Guideline
The Standard America Cannot Meet
The World Health Organization updated its air quality guidelines in 2021, tightening the recommended annual mean PM2.5 concentration from 10 μg/m³ to 5 μg/m³ — a threshold that reflects the accumulating evidence on the health effects of fine particulate matter at lower concentrations than previously considered problematic. The U.S. Environmental Protection Agency's own National Ambient Air Quality Standard for annual PM2.5 is 9 μg/m³, more permissive than the WHO guideline. By the EPA's own standard, several states are in compliance. By the WHO standard, only Wyoming, at 4.1 μg/m³, meets the threshold. Every other state in the American union exceeds the WHO guideline.
This is not primarily a story about regulatory failure — the EPA has progressively tightened its PM2.5 standards over the decades, and air quality across the United States has improved substantially since the Clean Air Act's passage in 1970. It is a story about the gap between what is achievable within current regulatory frameworks and what epidemiological evidence now suggests is necessary for genuinely healthy air. The WHO's 5 μg/m³ guideline is not an aspiration for developing countries struggling with coal combustion — it is the standard that the best current science says humans need to breathe safely. By that standard, America falls short everywhere except one state.
Every American state but Wyoming exceeds the WHO's air quality guideline for PM2.5. California's air — at 11.7 μg/m³ — is more than twice as polluted as the WHO considers safe for long-term health.
California at 11.7: The West Coast Paradox
California's 11.7 μg/m³ annual average PM2.5 — the highest of any state — is a result that surprises many people given California's reputation as a leader in environmental regulation. California has the most stringent vehicle emissions standards in the United States, has pioneered cap-and-trade carbon pricing, and has spent decades trying to improve air quality in the notoriously smog-prone Los Angeles basin. Yet it remains the most polluted state by this measure.
The explanation is multifactorial. California's geography traps air pollution: the Central Valley is bounded by mountain ranges on three sides that prevent pollutants from dispersing, creating some of the worst air quality in the country in Fresno, Bakersfield, and the San Joaquin Valley. Its massive port complex at Los Angeles and Long Beach — the busiest in the United States — generates enormous diesel emissions from ships, trucks, and port equipment that affect the broader Southern California airshed. California's climate — hot, dry, and increasingly prone to wildfire — adds substantial particulate matter from fire events that have grown dramatically in intensity and frequency as climate change has extended fire seasons. And its population of 39 million people, despite stringent per-vehicle emission controls, generates sheer volume of automotive and industrial emissions that no regulatory framework has yet reduced below threshold.
The wildfire contribution to California's PM2.5 readings deserves particular emphasis. The 2022-2024 averaging period includes years of significant wildfire activity, and wildfire smoke contributes fine particulate matter that is counted in the annual average. This means California's PM2.5 figure is partly a function of climate change accelerating its fire regime — a feedback loop in which climate-driven air quality deterioration makes the health case for climate action more urgent.
Pennsylvania at 11.0: The Industrial Belt
Pennsylvania's 11.0 μg/m³ ranking — second only to California — reflects a different pollution source mix. Pennsylvania's elevated readings are driven primarily by industrial point sources (steel, chemicals, manufacturing), traffic density in the Philadelphia and Pittsburgh metropolitan areas, and geographic factors that reduce air dispersion in the ridge-and-valley topography of the Appalachian region. The Pittsburgh metro in particular has historically had some of the worst air quality in the eastern United States, a legacy of its steel industry that has improved substantially but remains elevated relative to WHO standards.
Michigan at 10.4 and Illinois at 10.3 — both in the top five — reflect similar dynamics: heavily industrialised states with significant traffic density in major metropolitan areas, complicated by geographic factors that concentrate rather than disperse pollutants.
Wyoming's Clean Air: Thin Population, Open Sky
Wyoming at 4.1 μg/m³ — the only state below the WHO guideline — is primarily an artefact of its extraordinary combination of low population density, minimal industrial activity, and favorable geography. Wyoming has approximately 580,000 residents spread across a state of nearly 100,000 square miles, giving it a population density of about 6 people per square mile. With almost no heavy industry (its oil and gas extraction is economically significant but geographically dispersed), minimal traffic, and prevailing winds that sweep pollution out of the state, Wyoming benefits from what might be called structural air quality — cleanliness that results from the absence of pollution sources rather than active pollution control measures.
Montana (6.5), South Dakota (5.7), and New Mexico (5.9) cluster at the lower end of the distribution for similar reasons: low population density, minimal industrial activity, and geography that facilitates air dispersion. The pattern suggests that geography and economic structure are at least as important as regulatory stringency in determining state-level air quality outcomes.
The Health Burden of PM2.5
PM2.5 — fine particulate matter with a diameter of 2.5 micrometres or less — is the air pollutant most consistently associated with premature mortality in epidemiological studies. At 2.5 micrometres, these particles are small enough to penetrate deep into the alveoli of the lungs, cross into the bloodstream, and reach virtually every organ in the body. Long-term exposure has been associated with increased risk of cardiovascular disease, stroke, lung cancer, chronic obstructive pulmonary disease, type 2 diabetes, and — in more recent research — dementia and cognitive decline.
The Global Burden of Disease study estimates that ambient PM2.5 pollution is responsible for approximately 4 million deaths globally per year — making it one of the leading environmental risk factors for premature mortality worldwide. In the United States, the EPA estimates that its 2024 tightening of the annual PM2.5 standard from 12 μg/m³ to 9 μg/m³ will prevent approximately 4,500 premature deaths per year. The WHO's 5 μg/m³ guideline, if achieved, would prevent substantially more — which is why the gap between U.S. regulatory standards and WHO guidelines is not merely academic.
The India Comparison: Scale and Severity
Any discussion of air quality that includes India requires acknowledging the scale difference between American and Indian air pollution. The states in this dataset, even California at 11.7 μg/m³, would be considered relatively clean by Indian standards. India's most polluted cities — Delhi, Patna, Muzaffarpur, Faridabad — regularly record annual PM2.5 averages of 80-120 μg/m³, fifteen to twenty times the WHO guideline. The IQAir World Air Quality Report consistently ranks India as having some of the worst urban air quality in the world, with Delhi frequently named the most polluted capital city globally.
India's air quality crisis is driven by a combination of sources that American regulation has systematically addressed over fifty years: coal combustion (India still relies heavily on coal for electricity and industrial heat), agricultural stubble burning (the seasonal burning of crop residue in Punjab and Haryana creates smoke that blankets northern India each winter), vehicular emissions from an aging and poorly regulated vehicle fleet, construction dust, and biomass burning for cooking in rural households. The regulatory infrastructure — monitoring networks, emission standards, enforcement capacity — is being built, but the scale of the problem and the pace of Indian economic development create an enormous challenge.
The American experience — where sustained regulatory effort under the Clean Air Act reduced national PM2.5 concentrations by roughly 40% between 2000 and 2022 — is both encouraging and sobering for India. It demonstrates that dramatic improvements are achievable with consistent regulatory commitment, enforcement capacity, and technological transition in industry and transportation. It also demonstrates that even after fifty years of progress, the world's wealthiest economy still cannot meet the standard that its scientists consider genuinely health-protective. For India, the American air quality story is a long-run trajectory to aspire to, not a current benchmark to compare against — and the urgency of the problem makes even that long-run trajectory feel dangerously slow.
End of Brief · Prism